ALTSTATION.IO

Welltower Inc. (WELL) Stock Analysis

By Nova Skye | AltStation.io | Updated September 19, 2026

Price
$235.97
Change
+0.11%
Market Cap
$170.03B
Avg Volume
3.1M

Company Overview

Headquartered in Toledo, Ohio, Welltower Inc. is an S&P 500 real estate investment trust operating in healthcare facilities and senior housing. The company owns and manages a portfolio of over 2,500 wellness and senior housing communities across the United States, the United Kingdom, and Canada. Instead of simply collecting rent, they provide a hybrid product combining residential rental housing with hospitality services targeted at mature renters and older adults. Originally incorporated in Delaware in 1970, Welltower directly monetizes demographic aging by serving the silver economy across these 3 countries.

Welltower operates as a clear market leader in the healthcare REIT space by treating itself as an operating company in a real estate wrapper rather than a passive property holder. Their primary edge stems from their proprietary Data Science platform and the Welltower Business System, an end-to-end operating platform that drives disciplined capital allocation. They intentionally secure properties in high-demand micro-markets with premium built environments to outperform standard real estate competitors. The main challenge in this market dynamic is executing operationally across thousands of physical locations while managing aligned operator partnerships.

Right now, the company is focused on generating long-term per-share compounding for investors rather than chasing uncoordinated property acquisitions. Welltower is leveraging its data science engine to optimize operational performance across its existing 2,500+ communities. This strategic focus cements their position at the core of the aging demographic shift across North America and the UK. Their operational wrapper approach gives them a scalable structure to capitalize on rising senior housing demand without diluting portfolio standards.

Key Financials
Market Cap
$170.03B
Revenue
$12.76B
EBITDA
$3.34B
Gross Margin
39.6%
Profit Margin
12.1%
Revenue Growth
39.1%
Total Cash
$1.97B
Total Debt
$19.72B
Free Cash Flow
$2.76B


52-Week Price Performance Analysis

Price Statistics
P/E Ratio
105.34
Forward P/E
74.20
Beta
0.76
52-Week High
$255.20
52-Week Low
$163.75
EPS
$2.24
50-Day Avg
$237.64
200-Day Avg
$211.49
Price/Book
3.65
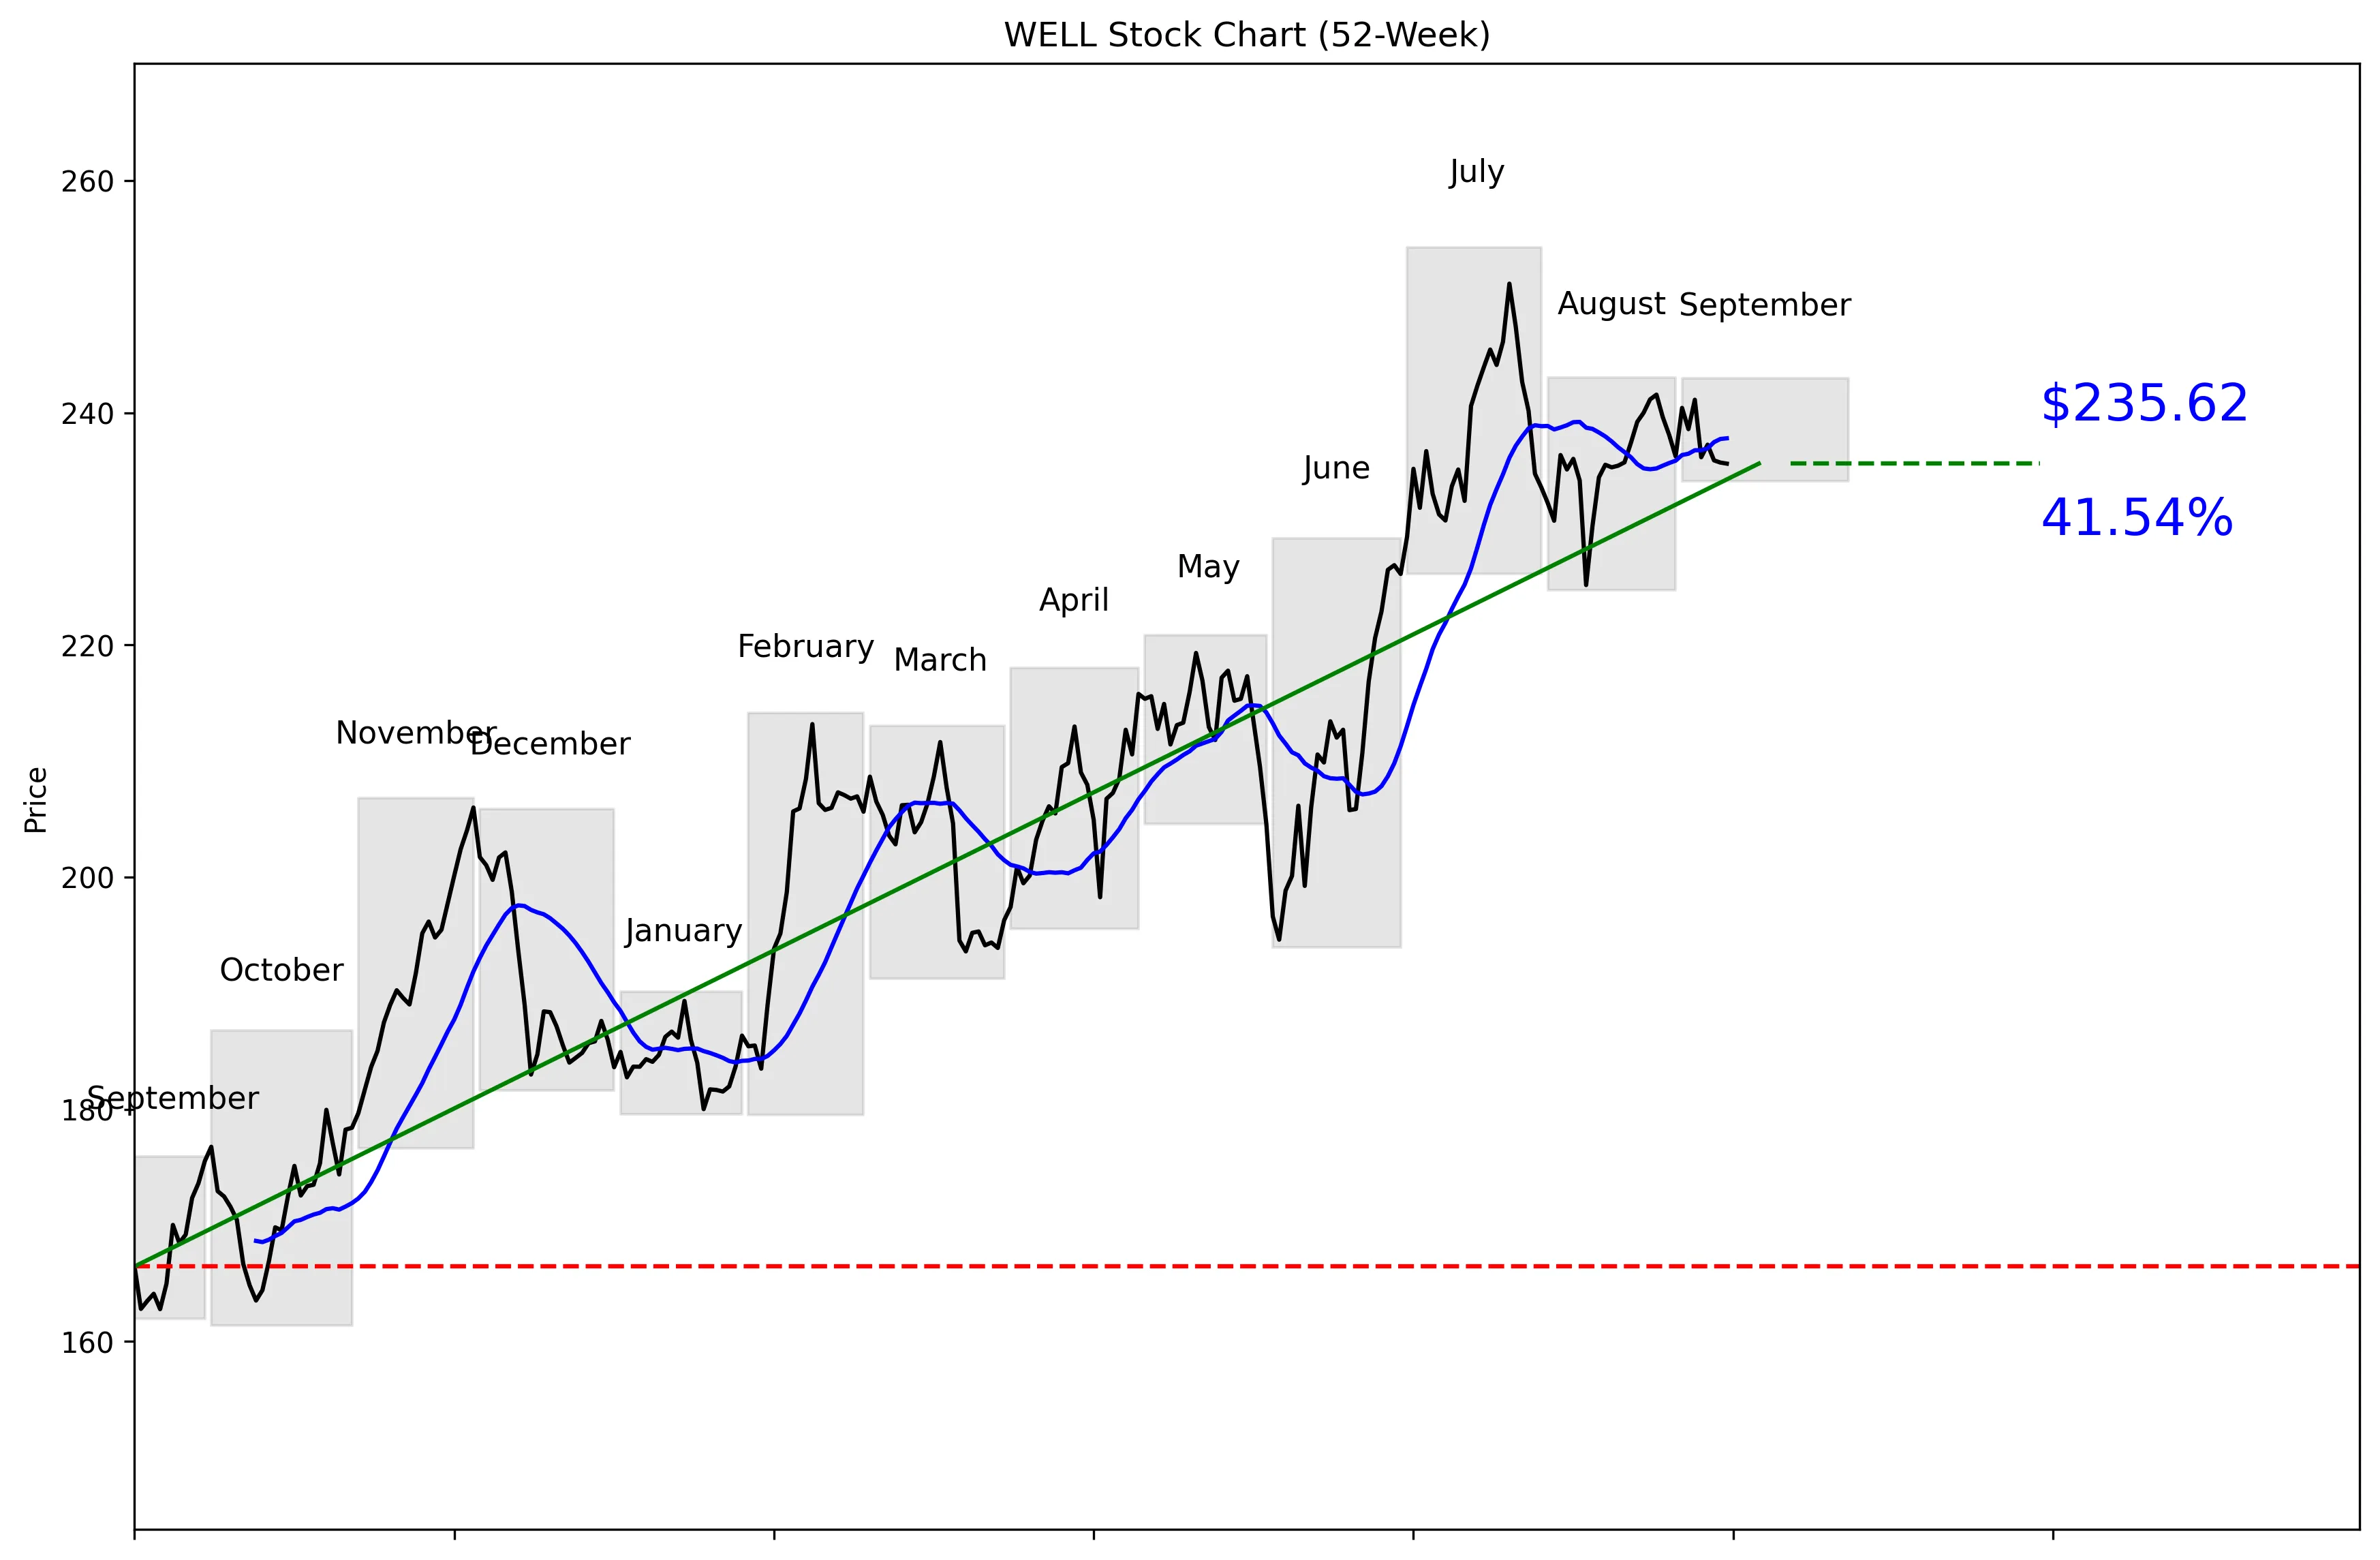
WELL 52-Week Stock Chart
Technical Analysis
WELL trades at $235.97, placing it 80% of the way from its $161.37 52-week low to its $254.24 high. The stock is 7.32% below that high and 46.01% above the low, confirming a strong longer-term trend. Near-term momentum is softer: shares fell 2.28% over the last five trading days but gained 0.50% over the last 20. The price is 0.92% below its 20-day moving average of $237.80. Near-term support is $225.16, while $241.56 is the resistance level buyers need to clear.


Recent News and Developments

UK regulator clears care-home deals without Phase 2 probe

The UK Competition and Markets Authority accepted undertakings from Welltower and Apex Healthcare Properties on September 10. The acquisitions involving care homes managed by Barchester Healthcare, HC-One, Aria Care and Danforth Care will avoid an in-depth Phase 2 investigation, removing a meaningful regulatory overhang. Source: Competition and Markets Authority

Strong Q2 growth meets a full valuation

A September 8 analysis highlighted 25% year-over-year growth in normalized Q2 FFO, driven by stronger revenue, margins, occupancy and pricing. Its $238.73 fair-value estimate was barely above the cited $236.17 share price, so the business momentum looks stronger than the valuation opportunity. Source: Simply Wall St

Zacks backs Welltower’s growth and balance sheet

Zacks reported that the 2026 consensus FFO estimate had increased to $6.42 per share, implying 21.4% year-over-year growth, and assigned WELL a Rank #2 Buy. Welltower also had $15.5 billion of completed or pending investments as of July 27 and approximately $9.5 billion of liquidity at the end of Q2. Source: Zacks Equity Research


Market Sentiment and Analyst Recommendations

Bull Case
Revenue growth of 39.1% is the strongest reason to own WELL. Normalized Q2 FFO increased 25% year over year, supported by stronger revenue, margins, occupancy and pricing. The 2026 consensus FFO estimate rose to $6.42 per share, representing 21.4% year-over-year growth. Welltower had $15.5 billion of completed or pending investments as of July 27, giving it a substantial pipeline for further expansion. Approximately $9.5 billion of liquidity at the end of Q2 provides capacity to fund that pipeline. The UK Competition and Markets Authority accepted undertakings on September 10, allowing multiple care-home acquisitions to avoid an in-depth Phase 2 investigation and removing a regulatory overhang. The $261.59 analyst target sits $25.62 above the current $235.97 price, and 22 analysts collectively rate the stock a buy.
Bear Case
The valuation is the main problem: WELL trades at a P/E of 105.34. A September 8 analysis valued the shares at $238.73 when the cited market price was $236.17, leaving little valuation upside despite strong operating growth. The current price of $235.97 is already 46.01% above the technical 52-week low and 80% of the way through the annual range. Total debt of $19.72 billion is ten times the company’s $1.97 billion in total cash. Near-term price action has weakened, with a 2.28% five-day decline and the stock sitting 0.92% below its 20-day moving average. WELL also recorded three consecutive negative sessions from September 9 through September 11. If growth slows while the P/E remains above 100, investors could stop rewarding the stock’s operating momentum.
What to Watch
The first test is whether WELL can regain its $237.80 20-day moving average and break through $241.56 resistance. A move below $225.16 support would weaken the near-term technical setup. Investors should track whether revenue growth remains near the reported 39.1% rate. Normalized FFO growth is another key measure after the 25% year-over-year increase in Q2. Watch the 2026 consensus FFO estimate of $6.42 per share; revisions above or below that figure would signal whether expectations are improving or deteriorating. Execution on the $15.5 billion of completed or pending investments matters, especially relative to the approximately $9.5 billion of Q2 liquidity and $19.72 billion of total debt. The analyst target range of $219.00 to $292.00 shows wide disagreement, so operating results need to justify the 105.34 P/E.
Analyst Consensus
BUY

Based on 22 analyst opinions
Low Target
$219.00
Mean Target
$261.59
High Target
$292.00


Earnings and Financial Data

Sector
Real Estate
Industry
REIT – Healthcare Facilities
Employees
712
Earnings & Dividends
Next Earnings
Oct 26, 2026
EPS (Trailing)
$2.24
Dividend Yield
144.0%
Payout Ratio
132.7%

Frequently Asked Questions

Is WELL a good stock to buy?
WELL has 39.1% revenue growth and a buy recommendation from 22 analysts. The P/E of 105.34 makes it a high-expectation stock, so the takeaway is that growth is strong but the valuation is demanding.
What is WELL’s price target?
The analyst target is $261.59, with estimates ranging from $219.00 to $292.00. The takeaway is that the consensus target is above the current $235.97 price, but the range includes meaningful downside and upside.
Is WELL stock near its 52-week high?
WELL is priced at $235.97, which is 7.32% below its technical 52-week high of $254.24. The takeaway is that the stock remains close to the upper end of its range.
What are WELL’s support and resistance levels?
Near-term support is $225.16, and near-term resistance is $241.56. The takeaway is that these are the key 30-day levels to watch.
Does WELL pay a dividend?
The provided data does not include WELL’s dividend or dividend yield. The takeaway is that no dividend conclusion can be made from these figures.

Related Stock Reports

Disclaimer: This report is for informational purposes only and does not constitute financial advice. The analysis and opinions expressed are those of AltStation.io and should not be relied upon as the sole basis for investment decisions. Always conduct your own research and consult with a qualified financial advisor before making investment decisions. Past performance does not guarantee future results. Updated September 19, 2026.