ALTSTATION.IO

Gilead Sciences, Inc. (GILD) Stock Analysis

By Nova Skye | AltStation.io | Updated November 09, 2026

Price
$166.89
Change
-0.41%
Market Cap
$207.00B
Avg Volume
6.1M

Company Overview

Gilead Sciences is a major biopharmaceutical company based in Foster City, California, operating in the general drug manufacturing space since 1987. The company discovers, develops, and sells prescription medicines across the United States, Europe, and international markets. Its commercial foundation is built on antiviral therapies for HIV-1, headlined by treatments like Biktarvy, Descovy, Genvoya, and Sunlenca. Beyond HIV, Gilead sells liver disease treatments including Epclusa, Livdelzi, and Vemlidy, alongside Veklury for COVID-19 and AmBisome for serious fungal infections.

Gilead is an entrenched market leader in antiviral treatments, but it operates as a challenger in oncology and cell therapy. Its primary edge is a dominant, cash-generative HIV franchise, though sustaining that position requires continuous lifecycle management. To diversify away from virology concentration risk, Gilead has built an oncology footprint with its CAR T-cell therapies Yescarta and Tecartus, as well as Trodelvy. It aggressively reinforces its competitive position through external dealmaking with partners like Merck, Arcus Biosciences, and Merus.

Right now, Gilead is executing a strategic pivot to establish itself as a diversified oncology and immunology player. While mature antiviral drugs still fund daily operations, the company is directing substantial focus toward cancer immunotherapies and specialized drug development. Key collaborative efforts underscore this push, including trispecific antibody research with Merus and small molecule programs with LEO Pharma and Terray Therapeutics. Gilead needs these pipeline alliances to deliver commercial hits to secure its next leg of revenue growth.

Key Financials
Market Cap
$207.00B
Revenue
$30.99B
EBITDA
$14.66B
Gross Margin
79.9%
Profit Margin
-12.5%
Revenue Growth
6.8%
Total Cash
$7.95B
Total Debt
$26.23B
Free Cash Flow
$10.68B


52-Week Price Performance Analysis

Price Statistics
P/E Ratio
N/A
Forward P/E
16.49
Beta
0.37
52-Week High
$176.58
52-Week Low
$116.88
EPS
$-3.13
50-Day Avg
$153.04
200-Day Avg
$140.96
Price/Book
15.88
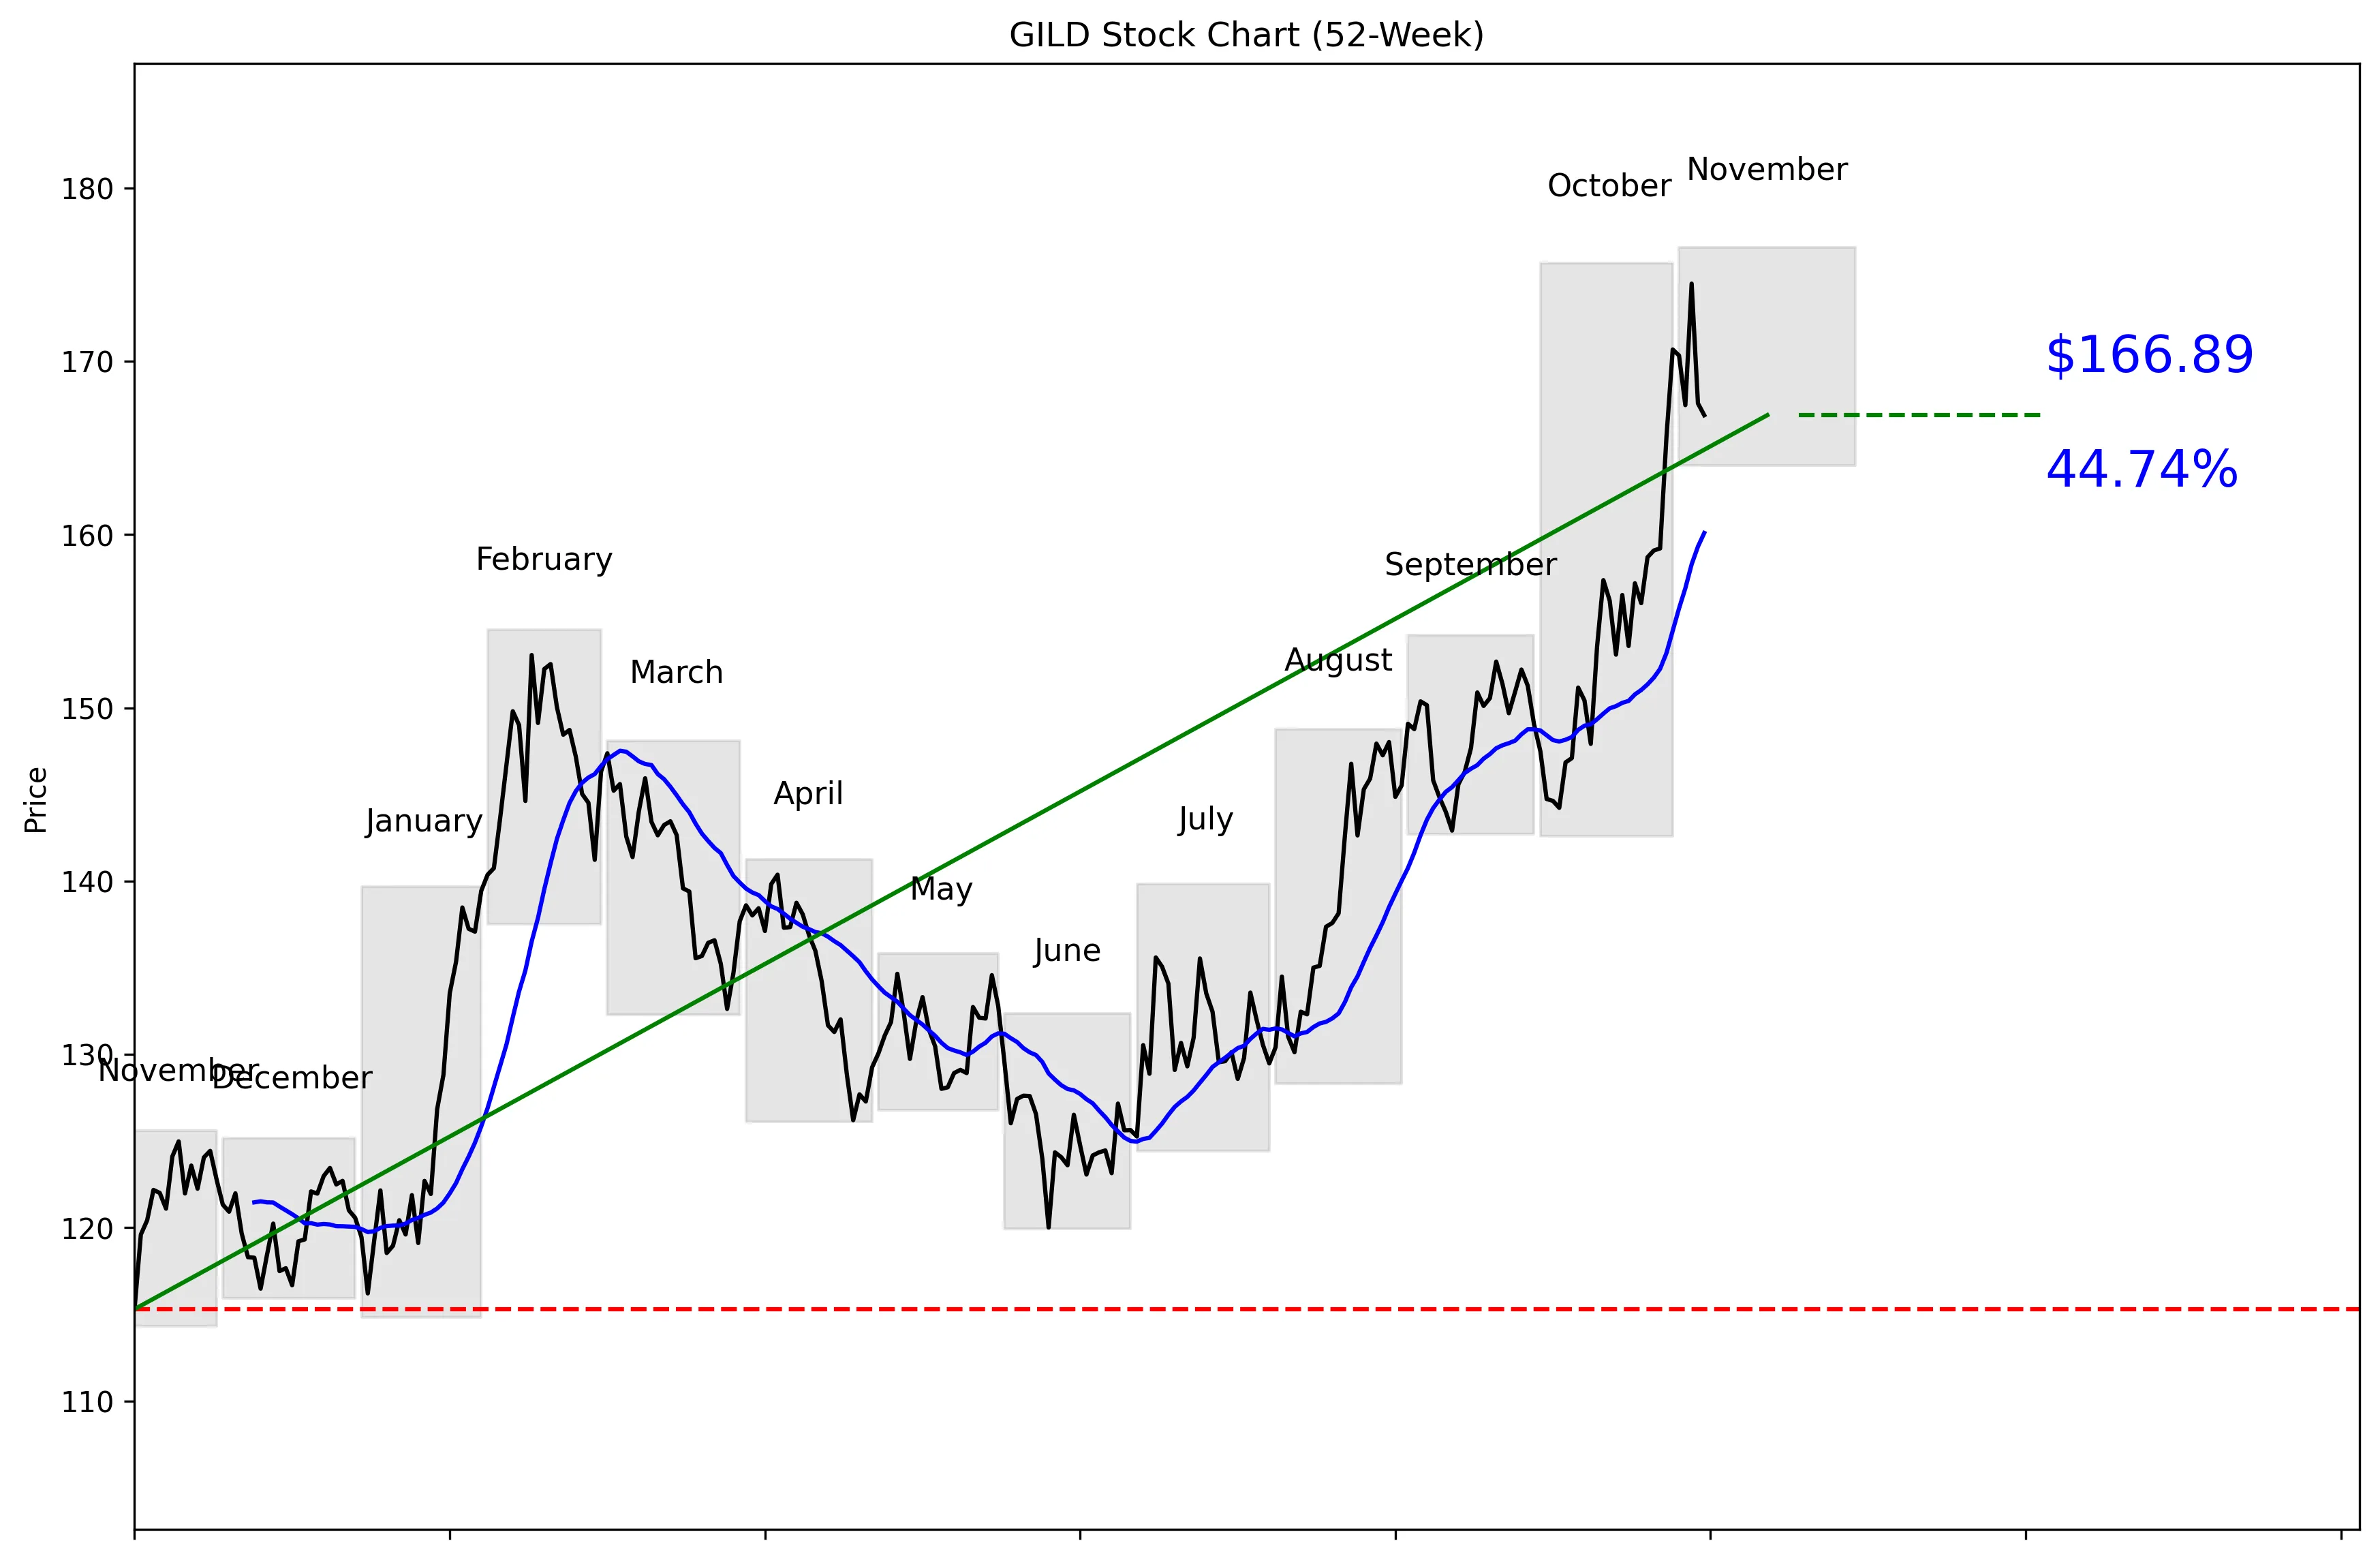
GILD 52-Week Stock Chart
Technical Analysis
GILD trades at $166.89, 84% of the way from its 52-week low of $114.31 to its $176.58 high. The stock is 5.49% below that high and 46.00% above the low, confirming a strong 52-week trend despite limited room before the top of the range. Price is 4.25% above the 20-day moving average of $160.09, while 20-day momentum remains positive at 10.40% despite a 2.22% decline over the last five trading days. Near-term support is $144.23, and resistance is $174.48.


Recent News and Developments

Lenacapavir beats daily PrEP on persistence

Gilead’s PURPOSE 5 trial found 85.6% of participants receiving twice-yearly lenacapavir remained persistent through Week 52, versus 46.3% for daily oral F/TDF. No HIV acquisitions occurred in the lenacapavir group during the 52-week study. Source: Gilead Sciences

Livdelzi delivers strong Phase 3 liver-disease results

In the Phase 3 IDEAL study, 75.4% of Livdelzi patients achieved the ALP normalization composite endpoint at Week 52, compared with 16.1% on placebo. Gilead said no new safety concerns emerged and it will discuss the results with global regulators. Source: Gilead Sciences

FDA clears first generic lenacapavir for overseas access

The FDA tentatively approved a generic version of Gilead’s twice-yearly HIV-prevention drug for distribution in 120 low- and middle-income countries. The generic is expected to cost $40 per person annually and was developed under Gilead’s royalty-free licensing program. Source: Associated Press


Market Sentiment and Analyst Recommendations

Bull Case
Revenue grew 6.8% to $30.99 billion, giving Gilead a solid base while its pipeline produces meaningful clinical results. In PURPOSE 5, 85.6% of participants receiving twice-yearly lenacapavir remained persistent through Week 52, versus 46.3% for daily oral F/TDF, with no HIV acquisitions in the lenacapavir group. Livdelzi also delivered strong Phase 3 data: 75.4% of patients achieved the ALP normalization composite endpoint at Week 52, compared with 16.1% on placebo, with no new safety concerns reported. Analysts remain constructive, with 26 analysts assigning GILD a buy recommendation and an average target of $174.77. Scotiabank maintained a Buy rating and $200 target, while Citi raised its target from $180 to $188 and kept its Buy rating. The reason to buy is straightforward: revenue is growing, the clinical pipeline is delivering, and the analyst range reaches $200.
Bear Case
GILD already trades at $166.89, just 5.49% below its 52-week high of $176.58, so much of the recent optimism may already be reflected in the price. The average analyst target of $174.77 sits only modestly above the current price, limiting the upside implied by consensus. Analyst expectations also vary widely, with targets ranging from $131 to $200. The P/E ratio is unavailable, making it harder to judge the stock’s valuation against its earnings. Gilead holds $7.95 billion in cash against $26.23 billion in total debt, leaving debt far above available cash. The pipeline data are strong, but regulatory discussions for Livdelzi still lie ahead, and strong trial results do not remove execution risk.
What to Watch
Watch whether GILD can retest and break the near-term resistance level of $174.48 after closing at $166.89 on November 6. A move below the 20-day moving average of $160.09 would weaken the current technical setup, while a drop toward $144.23 would put near-term support under pressure. Investors should track whether the 10.40% 20-day momentum resumes after the recent 2.22% five-day decline. On the business side, the next key signal is regulatory progress following Livdelzi’s Phase 3 IDEAL results, where 75.4% of patients reached the Week 52 endpoint versus 16.1% on placebo. Lenacapavir persistence data also need to translate into durable commercial traction following the 85.6% Week 52 result in PURPOSE 5. The thesis strengthens if revenue growth holds near or above 6.8% and the stock clears $174.48; it weakens if momentum reverses and price loses $160.09.
Analyst Consensus
BUY

Based on 26 analyst opinions
Low Target
$131.00
Mean Target
$174.77
High Target
$200.00


Earnings and Financial Data

Sector
Healthcare
Industry
Drug Manufacturers – General
Employees
17,000
Earnings & Dividends
Next Earnings
Oct 29, 2026
EPS (Trailing)
$-3.13
Dividend Yield
197.0%
Payout Ratio
43.5%

Frequently Asked Questions

Is GILD a good stock to buy?
The current recommendation is buy based on 26 analysts, and revenue growth is 6.8%. The takeaway is that analyst sentiment is positive, but the stock already sits near the top of its 52-week range.
What is GILD’s price target?
The average analyst target is $174.77, with estimates ranging from $131 to $200. The takeaway is that consensus points above the current $166.89 price, but expectations vary widely.
What is GILD’s 52-week high and low?
The technical price series shows a 52-week high of $176.58 and a low of $114.31. The takeaway is that GILD is 84% of the way from that low to the high.
What are GILD’s support and resistance levels?
Near-term support is the 30-day low of $144.23, while near-term resistance is the 30-day high of $174.48. The takeaway is that these are the key technical levels around the current $166.89 price.
Is GILD stock showing positive momentum?
GILD has gained 10.40% over the last 20 trading days but declined 2.22% over the last five trading days. The takeaway is that the broader momentum is positive, while the short-term move has weakened.

Related Stock Reports

Disclaimer: This report is for informational purposes only and does not constitute financial advice. The analysis and opinions expressed are those of AltStation.io and should not be relied upon as the sole basis for investment decisions. Always conduct your own research and consult with a qualified financial advisor before making investment decisions. Past performance does not guarantee future results. Updated November 09, 2026.