
Pfizer Inc. (PFE) Stock Analysis
By Nova Skye | AltStation.io | Updated September 19, 2026
Company Overview
Pfizer Inc. is a global pharmaceutical heavyweight headquartered in New York, United States, operating within the healthcare sector as a general drug manufacturer. Founded in 1849, the company develops, produces, and distributes prescription drugs, vaccines, biosimilars, and sterile injectables to healthcare systems, pharmacies, and patients worldwide. Its operations run across three distinct segments: Biopharma, PC1, and Pfizer Ignite. The commercial portfolio spans high-volume cardiovascular treatments like Eliquis and infectious disease therapies like Paxlovid to major oncology assets like Ibrance and Padcev.
Pfizer operates as an established market leader with unmatched global distribution and deep clinical reach. Its main competitive edge lies in high-value therapeutic areas like rare diseases, immunology, and oncology, reinforced by co-development agreements with Bristol-Myers Squibb, Astellas Pharma, and BioNTech. The primary threat to its base business remains patent expirations and fierce competition across mature therapeutic categories. Pfizer defends its position by expanding a broad portfolio of biosimilars and deploying complex, high-barrier therapies such as antibody-drug conjugates and bispecifics.
Right now, the company is executing a clear strategic pivot toward precision oncology and tech-driven drug discovery. A notable recent milestone is its collaboration with Boltz, PBC to develop and deploy biomolecular artificial intelligence foundation models. At the same time, Pfizer is expanding specialized cancer brands like Adcetris, Tivdak, and Elrexfio to build out durable revenue streams. The strategy is direct: replace legacy volume by prioritizing targeted, high-margin therapeutics and faster computational pipeline development.
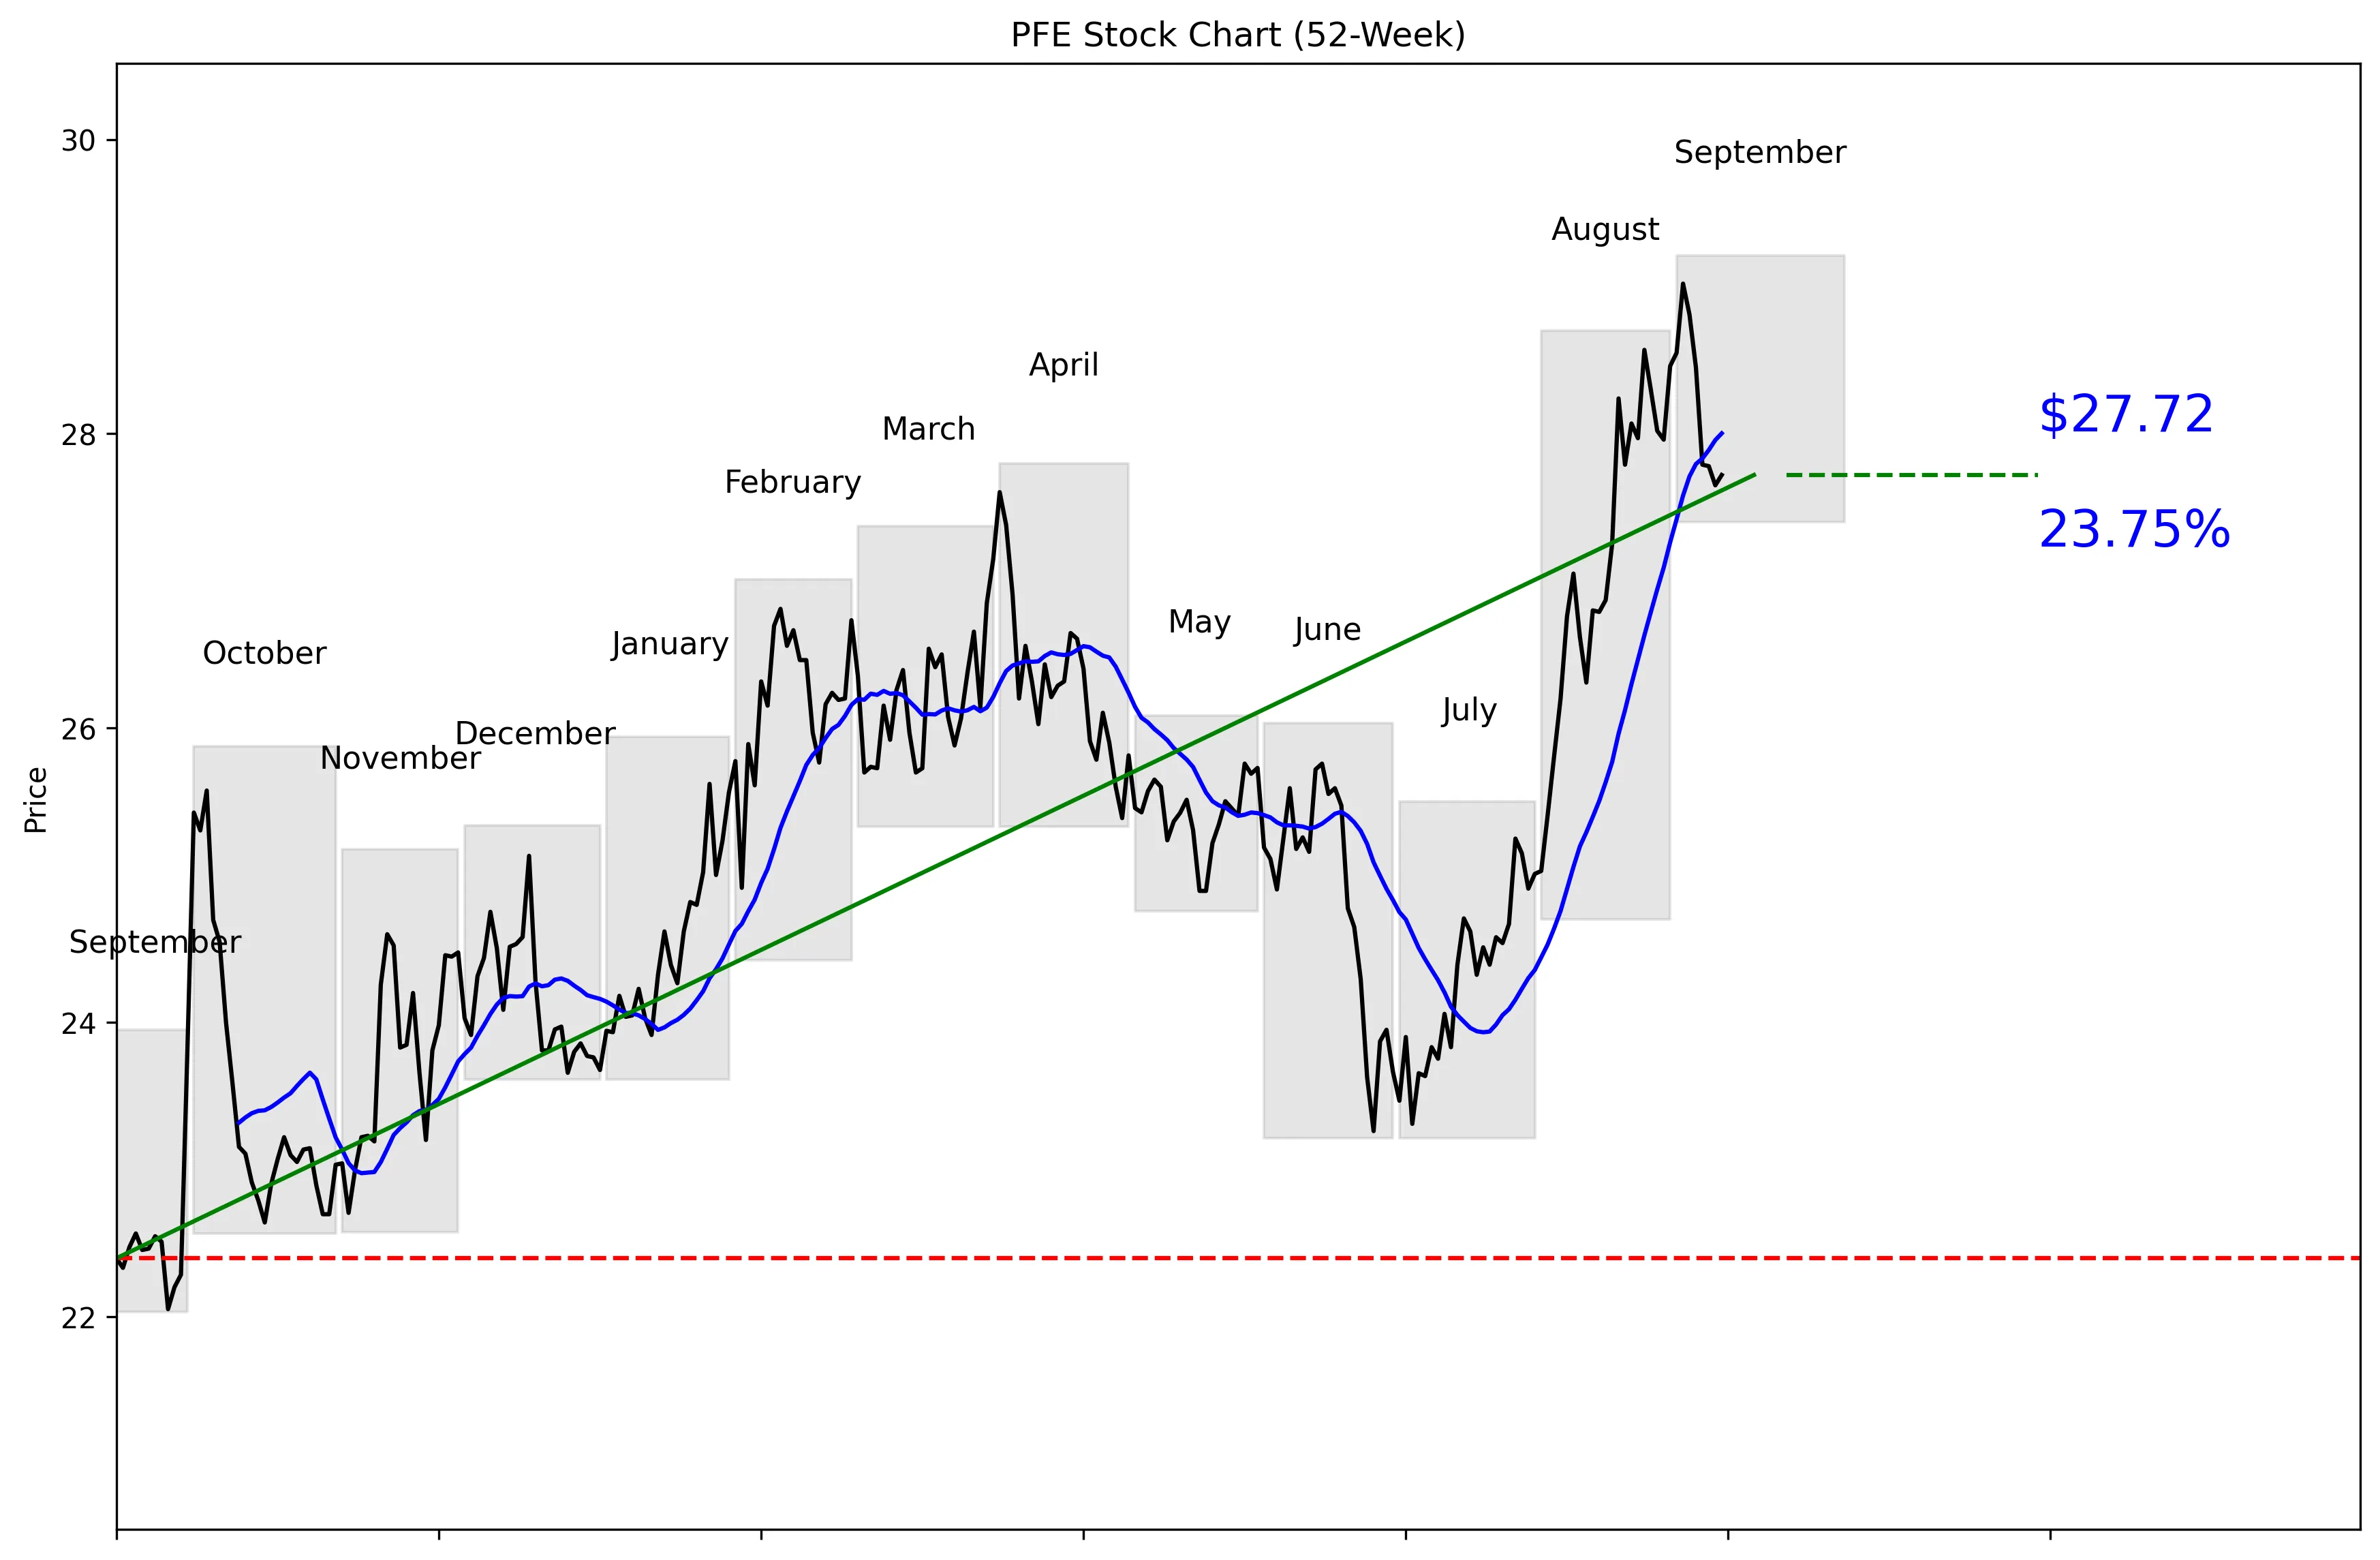
52-Week Price Performance Analysis
Recent News and Developments
No recent news available.
No recent news available.
No recent news available.
Market Sentiment and Analyst Recommendations
Earnings and Financial Data
Frequently Asked Questions
Related Stock Reports