ALTSTATION.IO

Eli Lilly and Company (LLY) Stock Analysis

By Nova Skye | AltStation.io | Updated October 23, 2026

Price
$1306.19
Change
+2.79%
Market Cap
$1.16T
Avg Volume
2.5M

Company Overview

Eli Lilly and Company is a major global pharmaceutical manufacturer founded in 1876 and headquartered in Indianapolis, Indiana. Operating within the healthcare sector as a general drug manufacturer, the company develops and sells prescription drugs across the United States, Europe, China, Japan, and international markets. Its product catalog is anchored in cardiometabolic health with diabetes treatments like Mounjaro and Jardiance, alongside obesity drug Zepbound. The company also sells targeted oncology therapies like Verzenio, immunology drugs such as Taltz and Omvoh, and neurological treatments including Kisubla for Alzheimer’s disease.

Lilly sits as an established market leader in metabolic and endocrine disease, driven by a deep portfolio of high-demand diabetes and weight-loss therapies. Its primary competitive edge comes from scale and commercial execution across multiple therapeutic classes, supported by key partnerships like its Jardiance collaboration with Boehringer Ingelheim. The main threats to this positioning include patent expirations across mature insulin lines like Humulin and Humalog, alongside intense competitive pressure across oncology and immunology. To protect its market share, Lilly must continually commercialize new molecules before legacy drug revenue erodes.

Lilly is currently in an expansion phase, scaling its core metabolic footprint while aggressively broadening into neurology and genetic medicine. Strategic licensing deals and alliances—including work with Chugai on orforglipron, Roche on lebrikizumab, and Ascidian on monogenic kidney disease therapies—highlight its forward pipeline push. This strategic pivot broadens revenue streams well beyond traditional insulin products into high-growth biopharma categories. Lilly enters this next phase with substantial commercial momentum across its newest specialty therapies.

Key Financials
Market Cap
$1.16T
Revenue
$79.67B
EBITDA
$41.71B
Gross Margin
83.4%
Profit Margin
33.5%
Revenue Growth
47.7%
Total Cash
$8.95B
Total Debt
$54.91B
Free Cash Flow
$11.07B


52-Week Price Performance Analysis

Price Statistics
P/E Ratio
43.85
Forward P/E
27.66
Beta
0.45
52-Week High
$1321.21
52-Week Low
$806.02
EPS
$29.79
50-Day Avg
$1183.59
200-Day Avg
$1082.90
Price/Book
34.37
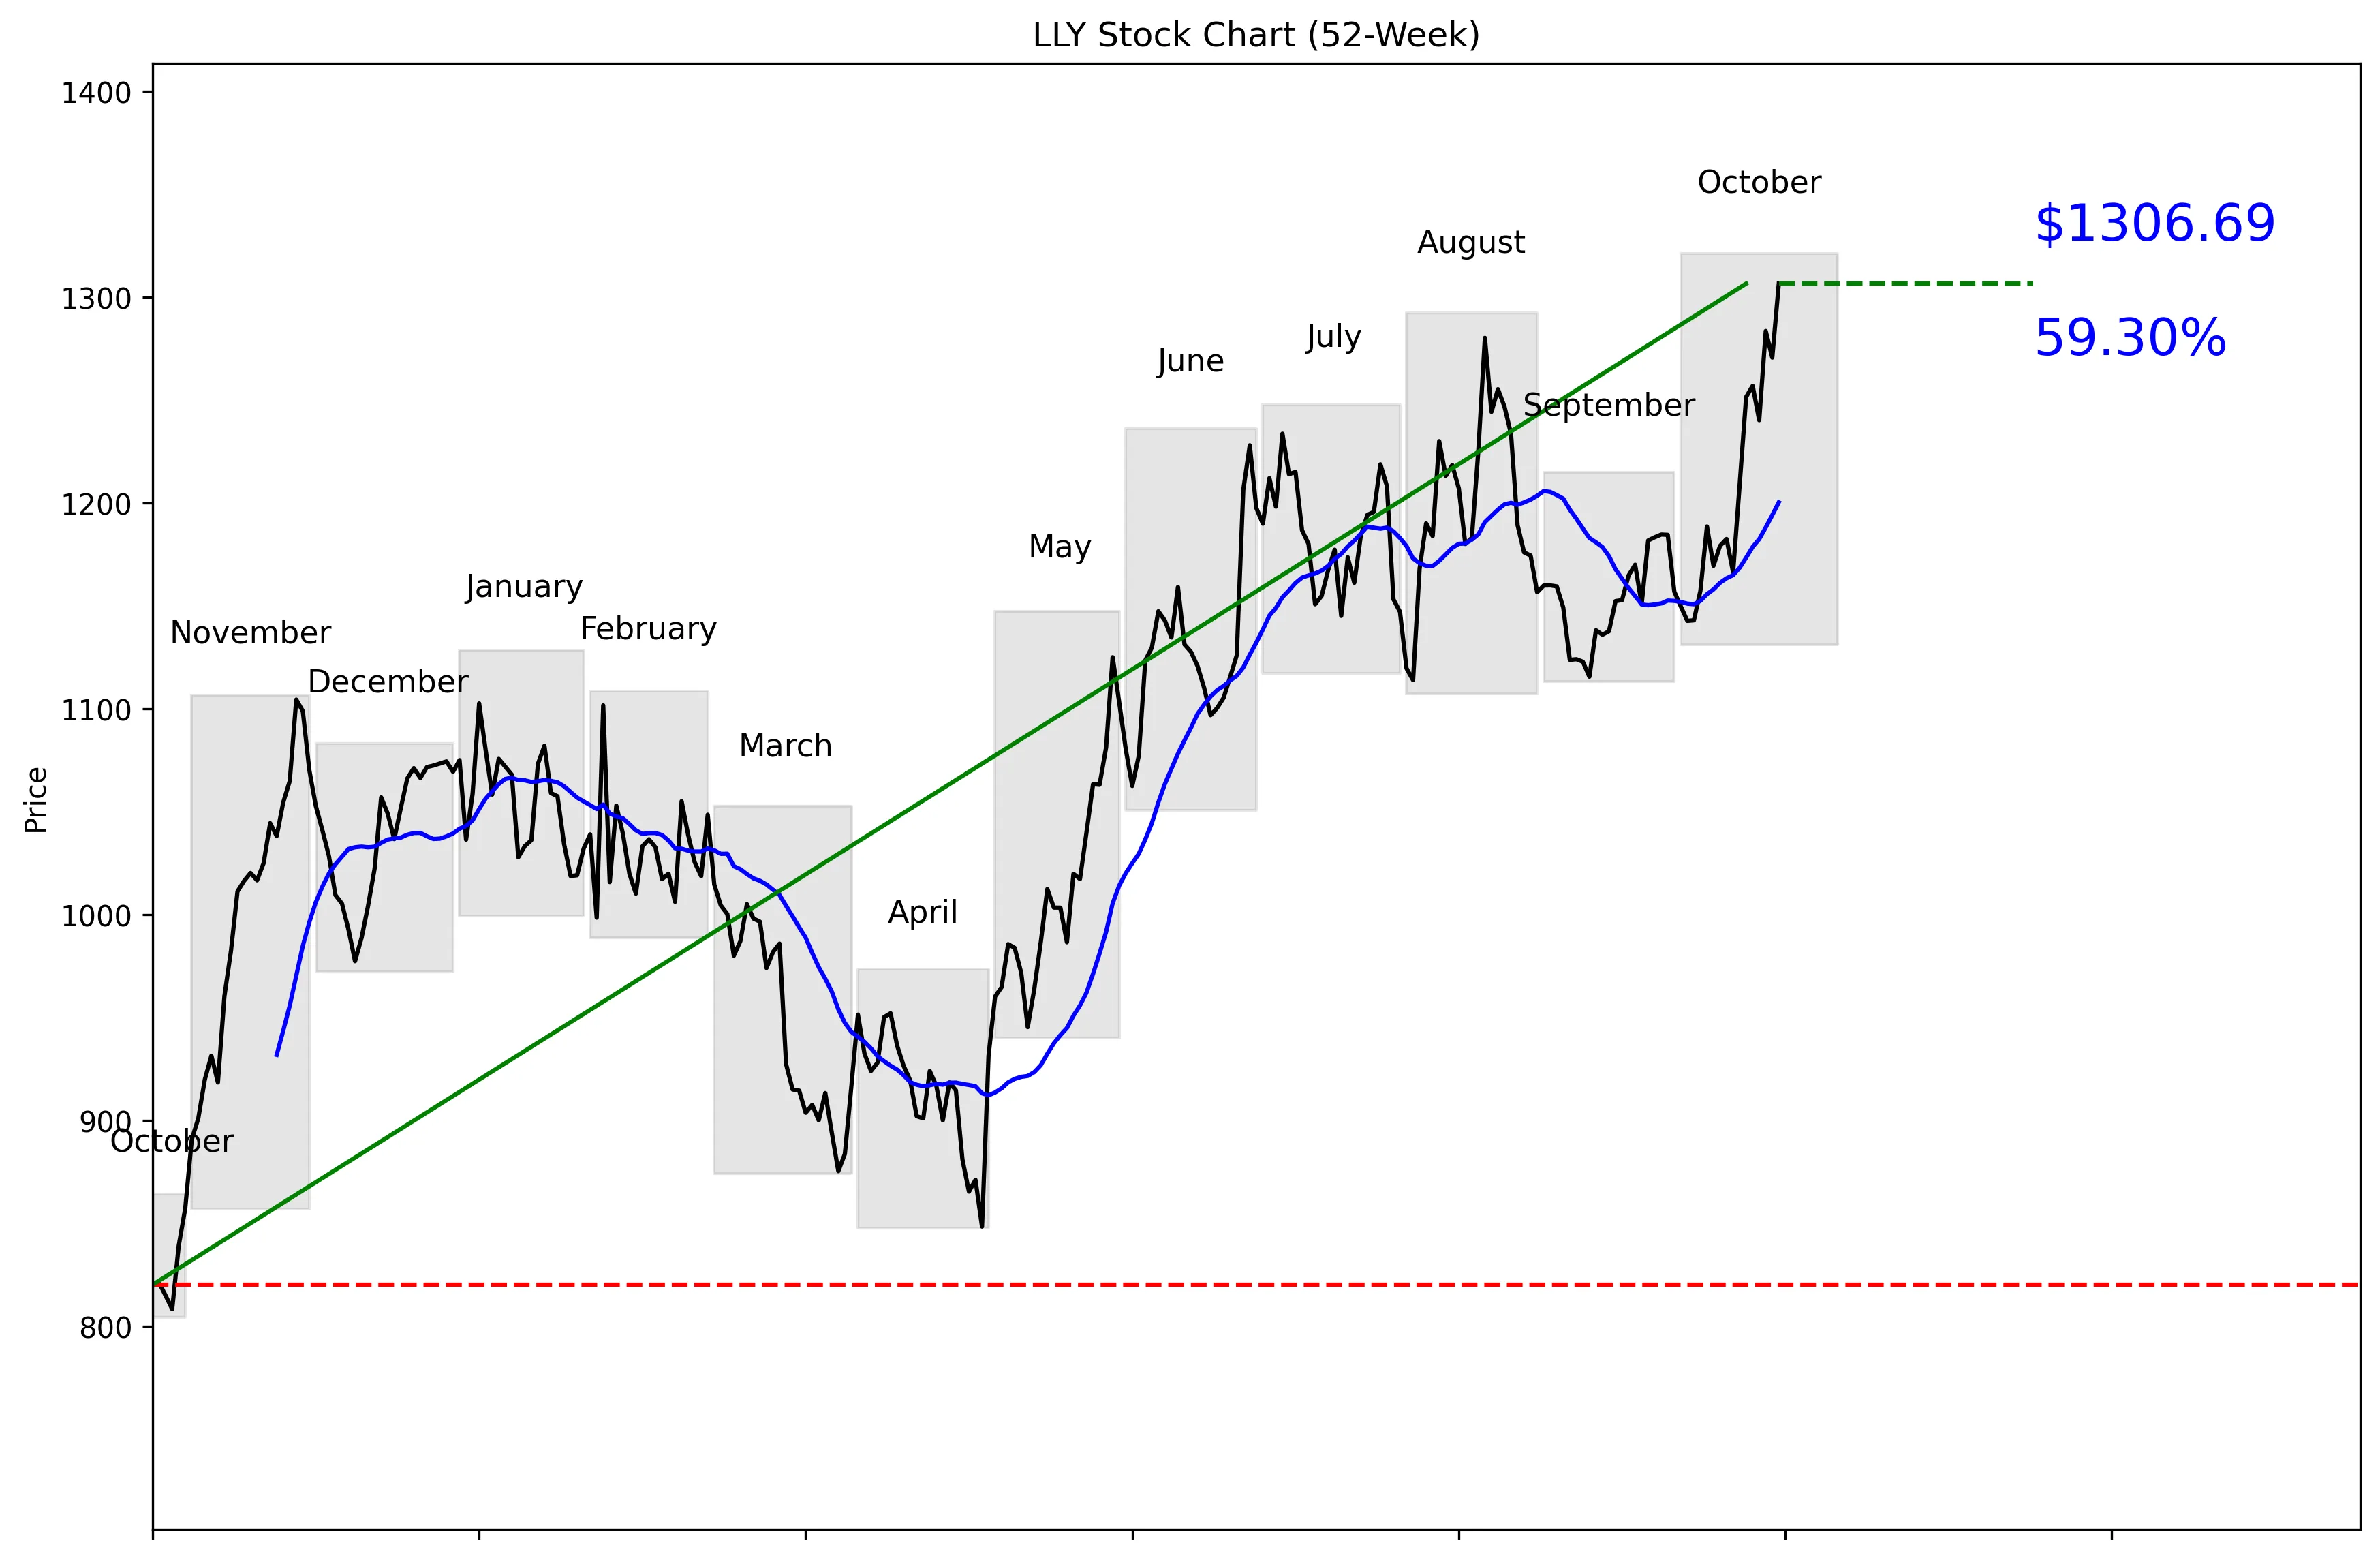
LLY 52-Week Stock Chart
Technical Analysis
LLY trades at $1306.19, just 1.10% below its $1321.21 52-week high and 62.41% above its $804.56 low. The stock sits 97% of the way from its 52-week low to its high, confirming a strong upward trend. Price is 8.85% above the 20-day moving average of $1200.44, while five-day and 20-day momentum stand at 4.40% and 10.56%. Near-term support is $1115.70, the 30-day low. Near-term resistance is $1306.69, the 30-day high, putting the current price directly below a key test.


Recent News and Developments

Europe backs Lilly’s oral GLP-1

European regulators published a positive opinion for Foundayo, Lilly’s orforglipron tablet, for type 2 diabetes and weight management. Lilly shares were up 1.44% at $1,269.60 when Benzinga reported the news on October 16, but this is a recommendation, not final European Commission approval or a product launch. Source: European Medicines Agency

Omvoh hits pediatric Phase 3 endpoint

Omvoh produced a clinical response in 81% of pediatric ulcerative colitis patients at Week 12. Among responders, 50% reached clinical remission at Week 52, and Lilly plans to submit the data to regulators for a potential pediatric label expansion. Source: Eli Lilly and Company

Leerink raises Lilly target to $1,316

Leerink Partners analyst David Risinger maintained an Outperform rating and raised the LLY price target from $1,309 to $1,316 on October 21. The $7 increase is modest and does not represent a rating upgrade. Source: Benzinga


Market Sentiment and Analyst Recommendations

Bull Case
Revenue is $79.67 billion and growing 47.7%, which is the clearest reason to own Lilly. European regulators issued a positive opinion for Foundayo, Lilly’s oral orforglipron tablet, covering type 2 diabetes and weight management. Omvoh produced a clinical response in 81% of pediatric ulcerative colitis patients at Week 12, and 50% of responders reached clinical remission at Week 52. Lilly is also expanding its oncology pipeline, with new and updated data covering ovarian cancer, lung cancer, Retevmo, and Verzenio. The company is backing that pipeline with a $5 billion Virginia manufacturing facility designed to produce antibody-drug conjugates and other advanced medicines. Thirty analysts rate the stock a buy, with a $1331.55 average target and a high estimate of $1600.00. The bull case is straightforward: exceptional revenue growth, multiple clinical catalysts, and aggressive manufacturing investment support continued expansion.
Bear Case
LLY trades at 43.85 times earnings, so investors are already paying heavily for future growth. The $1331.55 average analyst target sits only slightly above the current $1306.19 price, leaving limited consensus upside at this level. The stock is already 97% of the way through its 52-week range and only 1.10% below its high, which raises the risk of buying after a large move. Lilly has $8.95 billion in cash against $54.91 billion in total debt, while its new Virginia facility adds a $5 billion manufacturing commitment. Foundayo has received a positive regulatory opinion, but it does not yet have final European Commission approval and has not launched. Several oncology updates involve clinical trials, including Phase 1 data, so positive commercial outcomes are not guaranteed. No competitor or macroeconomic data was provided, but valuation, regulatory execution, clinical execution, and capital intensity are already substantial risks.
What to Watch
The first checkpoint is whether LLY can break above the $1306.69 near-term resistance level and challenge its $1321.21 52-week high. A drop toward the $1200.44 20-day moving average would test whether the current momentum remains intact, while $1115.70 is the stated near-term support level. Investors should track whether revenue growth can remain near the reported 47.7%, because the 43.85 P/E demands strong execution. Final European Commission action on Foundayo matters because the current positive opinion is not approval or a product launch. Lilly’s October 23-27 ESMO presentations should provide new Phase 1 sofetabart mipitecan data, updated olomorasib and Retevmo results, and postMONARCH overall-survival data for Verzenio. Omvoh’s regulatory submissions should also be watched for progress toward a pediatric label expansion. The thesis strengthens with regulatory approvals, durable revenue growth, and constructive clinical results; it weakens if momentum breaks, growth slows, or major pipeline programs disappoint.
Analyst Consensus
BUY

Based on 30 analyst opinions
Low Target
$930.00
Mean Target
$1331.55
High Target
$1600.00


Earnings and Financial Data

Sector
Healthcare
Industry
Drug Manufacturers – General
Employees
50,000
Earnings & Dividends
Next Earnings
Oct 29, 2026
EPS (Trailing)
$29.79
Dividend Yield
54.0%
Payout Ratio
21.7%

Frequently Asked Questions

Is LLY a good stock to buy?
Thirty analysts give LLY a buy recommendation, and the company reports 47.7% revenue growth. The takeaway is that analysts favor the stock, but its 43.85 P/E and position near the 52-week high make valuation important.
What is LLY’s price target?
The average analyst target is $1331.55, with estimates ranging from $930.00 to $1600.00. The takeaway is that analyst expectations vary widely and the average target is only slightly above the current $1306.19 price.
What is LLY’s 52-week high and low?
The technical price series shows a 52-week high of $1321.21 and a low of $804.56. The takeaway is that LLY sits near the top of its annual range at 97% of the distance from low to high.
What are LLY’s support and resistance levels?
Near-term support is the 30-day low of $1115.70, while near-term resistance is the 30-day high of $1306.69. The takeaway is that the current $1306.19 price is testing resistance.
Does LLY pay a dividend?
The provided data does not include LLY’s dividend rate, yield, or payment history. The takeaway is that no dividend conclusion can be made from the available figures.

Related Stock Reports

Disclaimer: This report is for informational purposes only and does not constitute financial advice. The analysis and opinions expressed are those of AltStation.io and should not be relied upon as the sole basis for investment decisions. Always conduct your own research and consult with a qualified financial advisor before making investment decisions. Past performance does not guarantee future results. Updated October 23, 2026.