ALTSTATION.IO

Amgen Inc. (AMGN) Stock Analysis

By Nova Skye | AltStation.io | Updated October 29, 2026

Price
$449.92
Change
+0.44%
Market Cap
$243.24B
Avg Volume
2.8M

Company Overview

Amgen Inc. is a biopharmaceutical manufacturer headquartered in Thousand Oaks, California, operating in the healthcare sector since its incorporation in 1980. The company develops and delivers targeted prescription therapeutics across immunology, bone health, cardiology, and oncology. Key commercial products include Enbrel and Otezla for inflammatory diseases, Prolia and EVENITY for osteoporosis, and Repatha to reduce cardiovascular risk. Amgen distributes these drugs through wholesale pharmaceutical channels to healthcare providers, including hospitals, clinics, dialysis centers, and pharmacies worldwide.

Amgen sits firmly as a market leader in the drug manufacturing space, anchored by a commercial catalog of more than 25 therapies. Its primary advantage comes from dominating high-barrier biological treatments and specialized indications like TEPEZZA for thyroid eye disease and KRYSTEXXA for chronic gout. To manage clinical development costs and expand global distribution, Amgen collaborates with major industry peers, including AstraZeneca on TEZSPIRE and UCB on EVENITY. The ongoing pressure point for the business is revenue erosion on older cornerstone drugs like Enbrel as competitor biologics and biosimilars enter the market.

Amgen is actively pivoting its revenue base toward newer oncology treatments and specialized therapies to offset its maturing product lines. Growth now hinges on expanding commercial assets like BLINCYTO for leukemia and IMDELLTRA, alongside pipeline partnerships with BeiGene for cancer treatments and Kyowa Kirin on rocatinlimab. Shifting toward targeted specialty drugs gives the company stronger pricing power than broad primary-care medications. The critical test for Amgen is whether its newer oncology and immunology pipeline can scale fast enough to outrun the slowdown in its mature portfolio.

Key Financials
Market Cap
$243.24B
Revenue
$38.09B
EBITDA
$17.27B
Gross Margin
71.9%
Profit Margin
23.0%
Revenue Growth
9.5%
Total Cash
$13.99B
Total Debt
$57.30B
Free Cash Flow
$8.65B


52-Week Price Performance Analysis

Price Statistics
P/E Ratio
27.95
Forward P/E
18.37
Beta
0.41
52-Week High
$454.66
52-Week Low
$288.00
EPS
$16.10
50-Day Avg
$418.42
200-Day Avg
$372.79
Price/Book
20.81
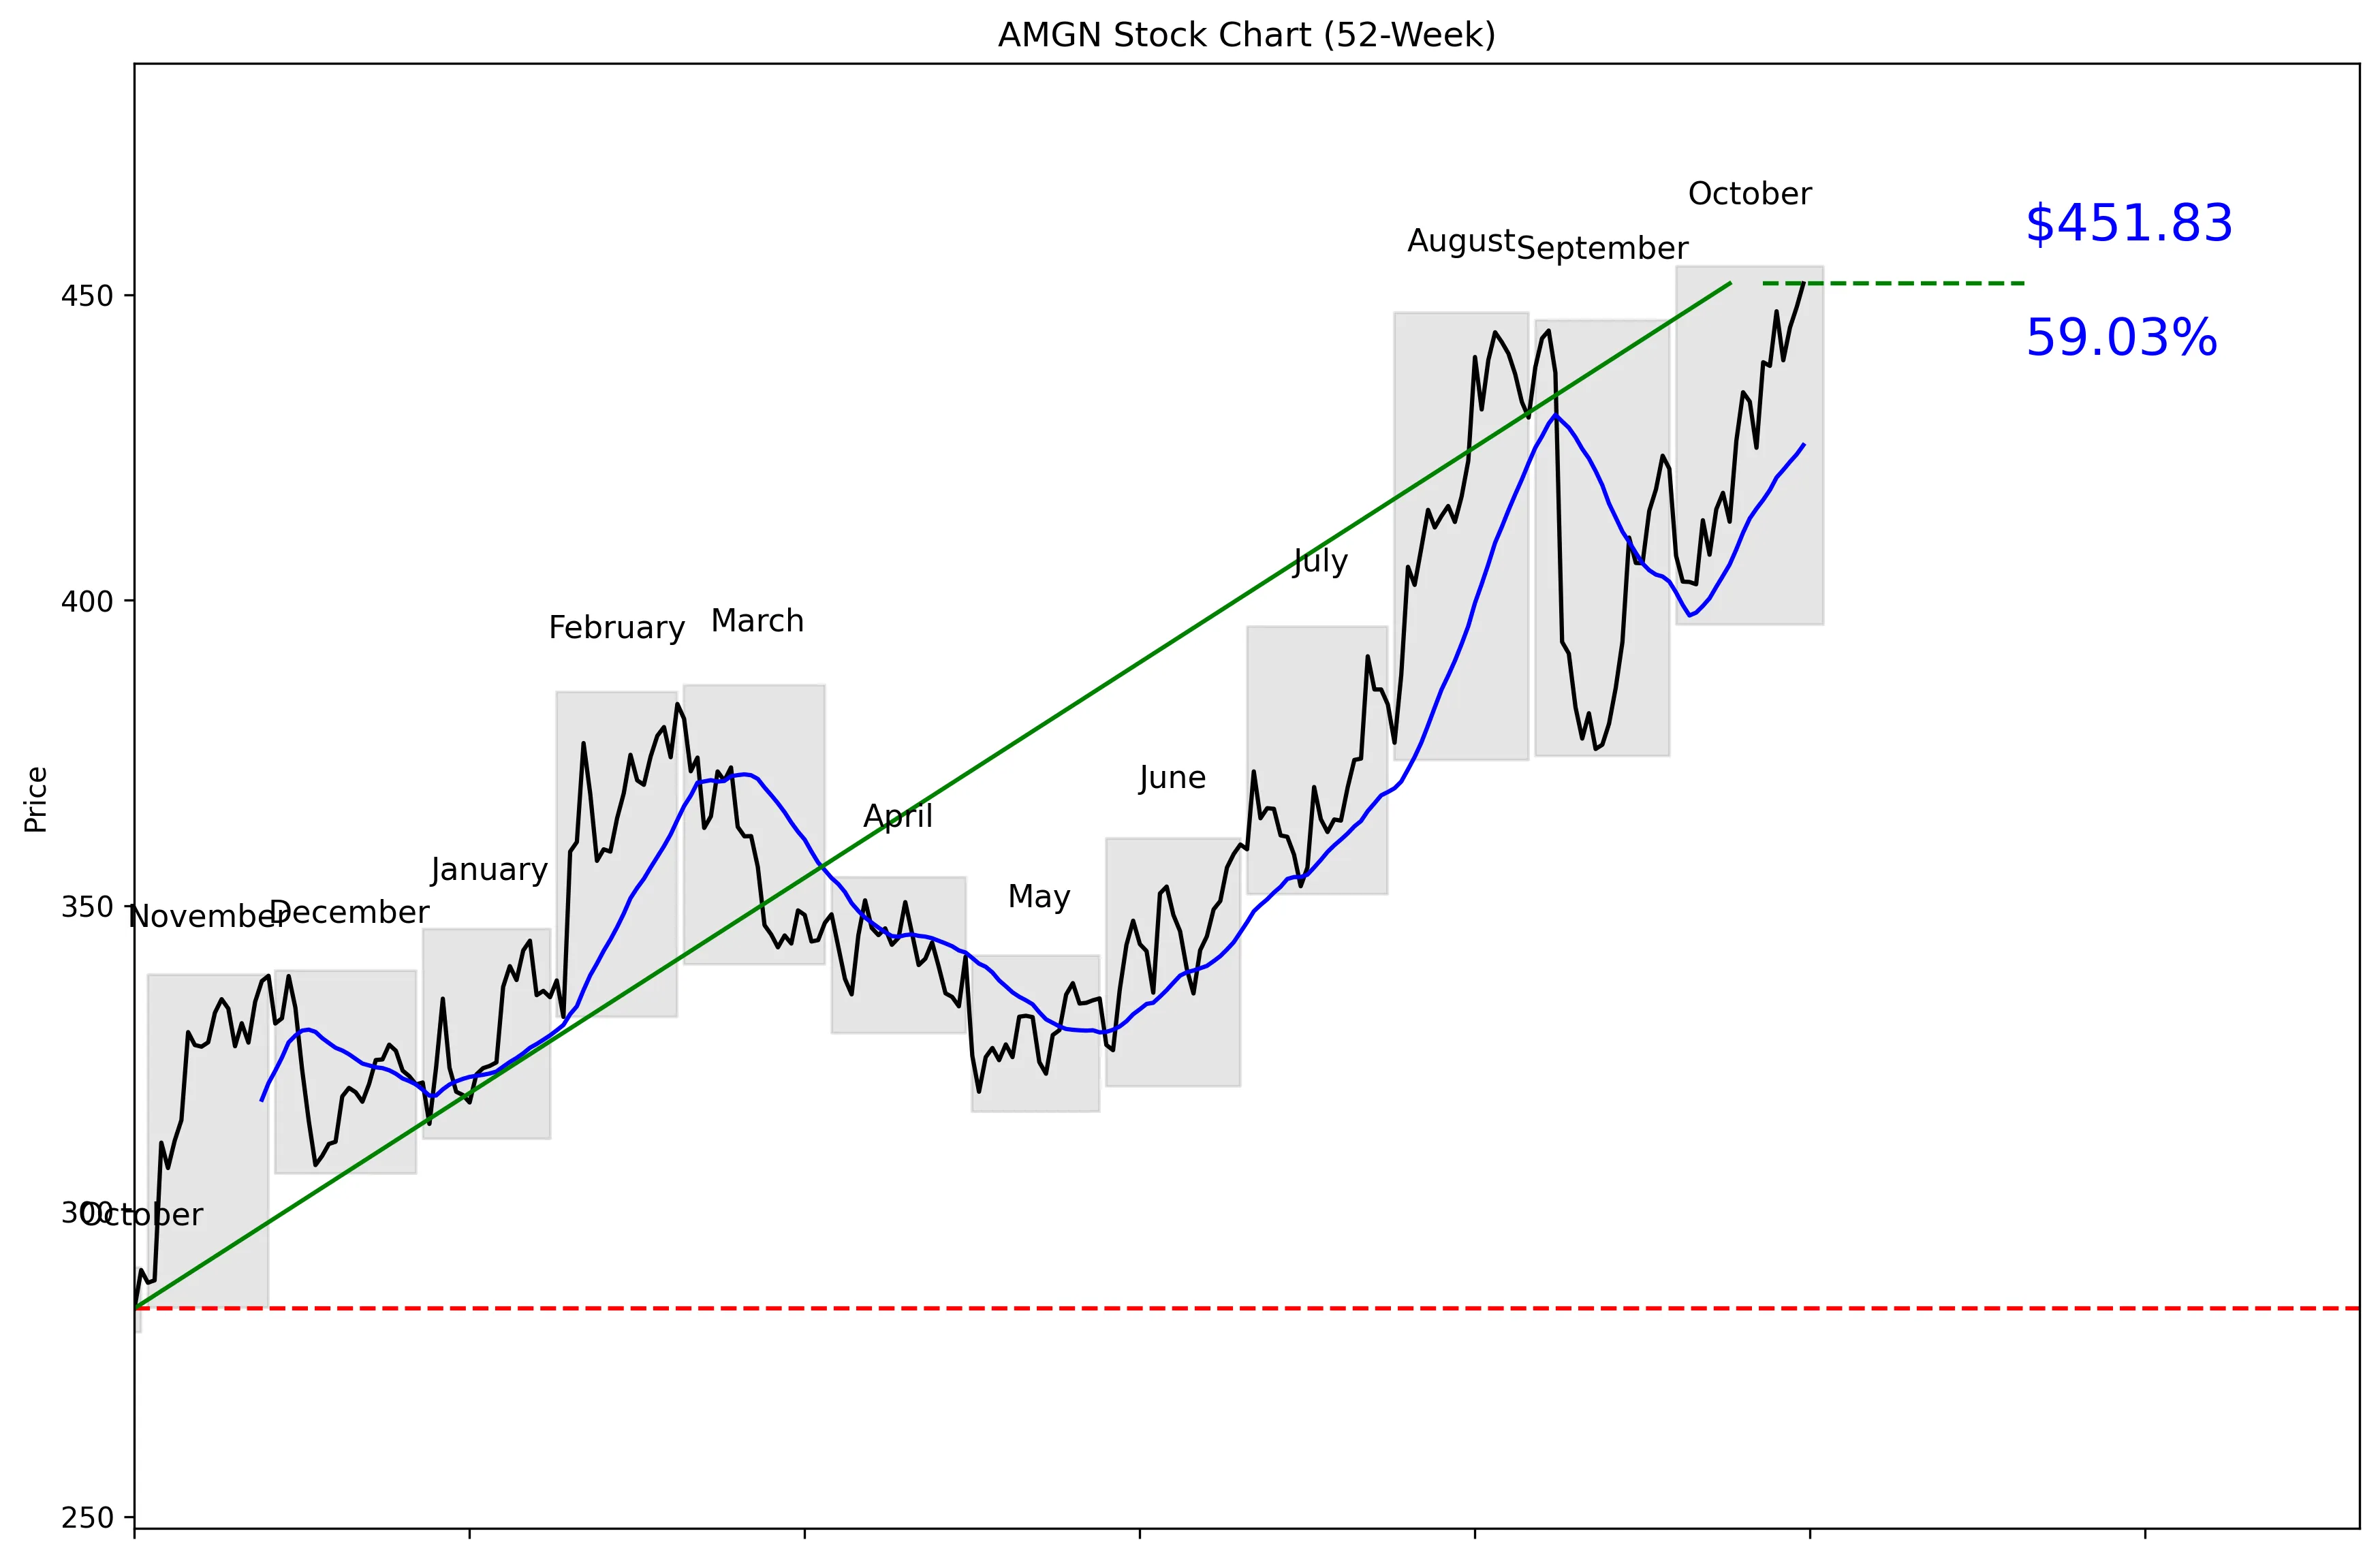
AMGN 52-Week Stock Chart
Technical Analysis
AMGN trades at $449.92, just 0.62% below its $454.66 52-week high and 61.24% above its $280.23 low. The stock sits 98% of the way from the low to the high, confirming a strong 52-week trend. Price is 6.22% above the 20-day moving average of $425.37, while momentum is positive at 3.08% over five trading days and 7.19% over 20 trading days. Near-term support is the 30-day low of $379.78. Near-term resistance is $451.83, which is already below the 52-week high.


Recent News and Developments

Imdelltra combination cuts death risk 58% in lung cancer trial

Imdelltra plus Imfinzi reduced the risk of death by 58% versus Imfinzi alone in the Phase 3 DeLLphi-305 trial. Median overall survival reached 21.1 months versus 12.7 months, and Amgen plans to share the results with regulators worldwide. Source: Amgen

Dazodalibep succeeds in Phase 3 Sjögren’s disease trial

Both tested dazodalibep dosing regimens produced statistically significant and clinically meaningful reductions in systemic disease activity at Week 48 versus placebo. This targets a disease with no FDA-approved medicines, giving Amgen a potentially important new pipeline asset. Source: Amgen

Oppenheimer raises Amgen target to $480

Oppenheimer raised its AMGN price target from $450 to $480 and maintained an Outperform rating. The stock was trading at $447.28, near its $450.98 52-week high, after gaining 57% over the preceding year. Source: Investing.com


Market Sentiment and Analyst Recommendations

Bull Case
Revenue grew 9.5% to $38.09 billion, giving Amgen solid operating momentum at a massive scale. Imdelltra plus Imfinzi reduced the risk of death by 58% in the Phase 3 DeLLphi-305 trial, with median overall survival reaching 21.1 months versus 12.7 months. Dazodalibep also met its Phase 3 goals in Sjögren’s disease, a market with no FDA-approved medicines. Those results give Amgen two meaningful pipeline catalysts rather than a story dependent on one product. Oppenheimer raised its target from $450 to $480 and kept an Outperform rating, while the highest analyst target is $500. Amgen also has $13.99 billion in cash and a $243.24 billion market cap. The bull case is straightforward: revenue is growing, the pipeline is delivering, and successful regulatory progress could support a valuation above the current $449.92 price.
Bear Case
AMGN is priced for strong execution at 27.95 times earnings and 98% of the way through its 52-week range. The consensus analyst target is $397.32, below the current $449.92 price. The broader recommendation is hold across 29 analysts, despite Oppenheimer’s more bullish $480 target. Debt is the clearest balance-sheet concern: Amgen carries $57.30 billion in total debt against $13.99 billion in cash. The stock is also 6.22% above its 20-day moving average, so disappointing news could trigger a sharp reset toward the $425.37 average or lower. Imdelltra and dazodalibep still require successful regulatory and commercial execution after their trial results. At this price, the risk is not that Amgen is a weak company; it is that investors are paying heavily before the pipeline’s value is fully proven.
What to Watch
Amgen reports third-quarter 2026 results after the market closes on November 3, followed by its investor call at 4:30 p.m. ET. Revenue growth is the first checkpoint, with the current figure at 9.5% and total revenue at $38.09 billion. Investors should watch for regulatory updates on Imdelltra after the combination cut death risk by 58% and produced median overall survival of 21.1 months. Dazodalibep’s next steps also matter because both tested regimens delivered significant results at Week 48. On the chart, $451.83 is the immediate resistance level, followed by the $454.66 52-week high. A move below the $425.37 20-day moving average would weaken the near-term trend, while $379.78 remains the stated 30-day support. The thesis improves if growth holds and regulators advance the pipeline; it weakens if earnings disappoint while the stock remains above the $397.32 consensus target.
Analyst Consensus
HOLD

Based on 29 analyst opinions
Low Target
$225.00
Mean Target
$397.32
High Target
$500.00


Earnings and Financial Data

Sector
Healthcare
Industry
Drug Manufacturers – General
Employees
31,500
Earnings & Dividends
Next Earnings
Nov 03, 2026
EPS (Trailing)
$16.10
Dividend Yield
225.0%
Payout Ratio
60.9%

Frequently Asked Questions

Is AMGN a good stock to buy?
AMGN has 9.5% revenue growth and positive momentum, but the consensus recommendation from 29 analysts is hold. At $449.92 and 98% of the way through its 52-week range, the clear takeaway is that the business is performing better than the current entry price looks.
What is AMGN’s price target?
The consensus analyst target is $397.32, with estimates ranging from $225.00 to $500.00. The takeaway is that analyst expectations vary widely and the consensus target sits below the current $449.92 price.
Is AMGN overvalued?
AMGN trades at a P/E ratio of 27.95 and currently sits just 0.62% below its 52-week high. The takeaway is that the stock carries a demanding valuation near the top of its range.
What are AMGN’s support and resistance levels?
Near-term support is $379.78, based on the 30-day low, while near-term resistance is $451.83, based on the 30-day high. The takeaway is that AMGN is trading close to resistance and well above stated support.
How strong is AMGN’s momentum?
AMGN gained 3.08% over the last five trading days and 7.19% over the last 20 trading days, with price 6.22% above the $425.37 20-day moving average. The takeaway is that momentum is clearly positive but technically extended.

Related Stock Reports

Disclaimer: This report is for informational purposes only and does not constitute financial advice. The analysis and opinions expressed are those of AltStation.io and should not be relied upon as the sole basis for investment decisions. Always conduct your own research and consult with a qualified financial advisor before making investment decisions. Past performance does not guarantee future results. Updated October 29, 2026.