
McCormick & Company, Incorporated (MKC) Stock Analysis
By Nova Skye | AltStation.io | Updated September 19, 2026
Company Overview
McCormick & Company, based in Hunt Valley, Maryland, is a packaged foods powerhouse in the consumer defensive sector. Founded in 1889, the company manufactures and distributes spices, seasoning mixes, condiments, and flavor systems across two core divisions: Consumer and Flavor Solutions. Its retail arm supplies grocery chains, warehouse clubs, and e-commerce platforms with heavy-hitting staples like Frank’s RedHot, French’s, Cholula, and OLD BAY. On the commercial side, its Flavor Solutions segment sells custom seasoning blends, coatings, and compound flavors directly to multinational food manufacturers and foodservice operators.
McCormick operates as the dominant global market leader in seasonings and flavor, controlling prime supermarket shelf space that rivals cannot easily displace. Its primary competitive edge is a dual-engine business model that captures high-margin household brand loyalty while simultaneously supplying industrial food giants behind the scenes. The biggest threat is private-label pressure and discount retail channels as price-conscious consumers look to trim grocery bills. McCormick defends against this squeeze by producing store brands alongside its premium lineup, maintaining volume even during consumer trade-downs.
Financially, McCormick is generating steady, low-single-digit expansion rather than high-growth fireworks. In fiscal 2024, net sales rose 1% to $6.72 billion, driven by $3.85 billion in Consumer revenue and $2.88 billion from Flavor Solutions. Adjusted earnings per share climbed over 9% to $2.95 from $2.70 in 2023, reflecting solid pricing discipline and operating leverage. Management converted that performance into $922 million of operating cash flow, using the capital to pay down debt and raise the quarterly dividend by 7%, marking 39 straight years of payout hikes.
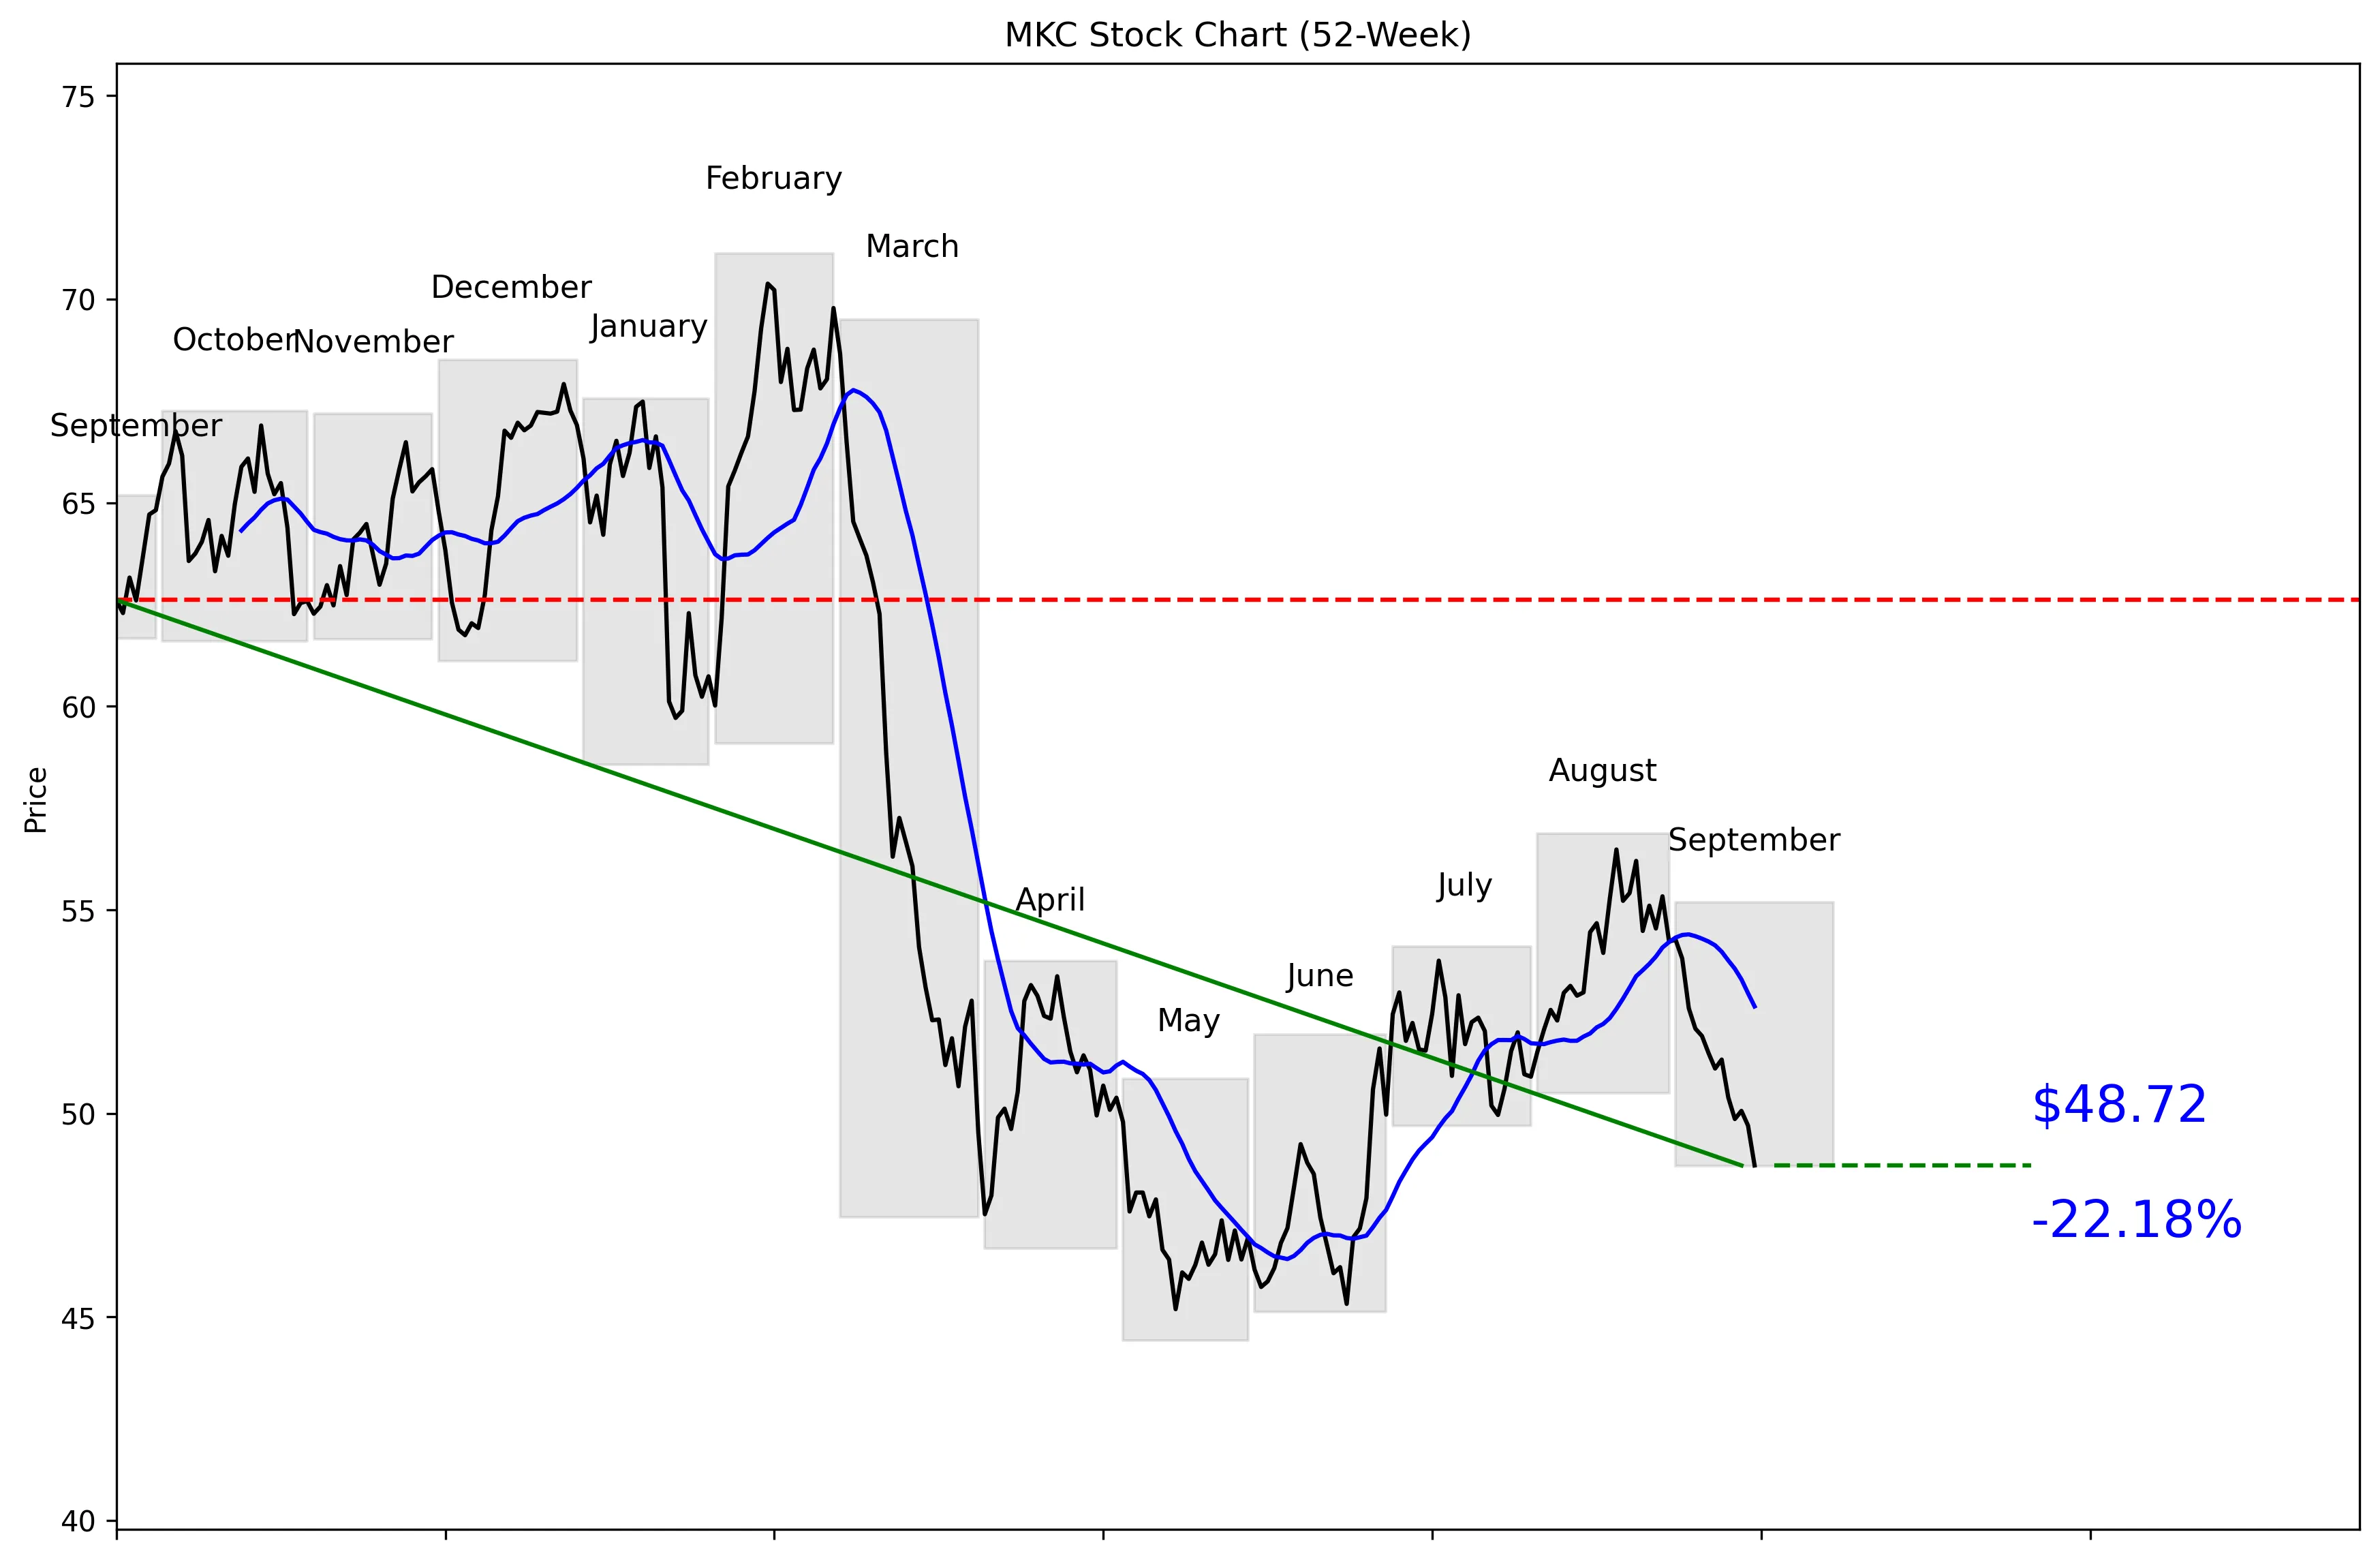
52-Week Price Performance Analysis
Recent News and Developments
No recent news available.
No recent news available.
No recent news available.
Market Sentiment and Analyst Recommendations
Earnings and Financial Data
Frequently Asked Questions
Related Stock Reports