ALTSTATION.IO

Deere & Company (DE) Stock Analysis

By Nova Skye | AltStation.io | Updated October 04, 2026

Price
$678.91
Change
+1.75%
Market Cap
$183.05B
Avg Volume
1.2M

Company Overview

Deere & Company is a Moline, Illinois-based equipment manufacturer operating in the Industrials sector under the Farm & Heavy Construction Machinery industry. Founded in 1837, the business manufactures and distributes machinery worldwide across four segments: Production and Precision Agriculture, Small Agriculture and Turf, Construction and Forestry, and Financial Services. Its product portfolio spans large row-crop tractors, harvesters, and sprayers for commercial farms, alongside excavators, crawler dozers, and asphalt pavers for construction and logging contractors. Deere also sells mowing and turf equipment to residential, commercial, and golf course customers while providing wholesale dealer financing, retail leases, and extended warranties.

Deere holds a market-leading position in agricultural machinery and serves as a primary heavyweight in construction equipment. Its main competitive edge comes from deep vertical integration, pairing specialized field machinery with an in-house financial services engine that funds both dealers and buyers. The company faces ongoing exposure to broader macroeconomic cycles in crop production, commercial building, and infrastructure development. Still, Deere defends its moat by pairing hardware with specialized attachments, replacement parts, and captive credit that keep operators tied to its network.

Right now, Deere is leaning into automated, high-efficiency equipment, directing core resources into its Production and Precision Agriculture division for enhanced soil preparation, seeding, and crop care. The company is also expanding specific product categories through collaboration, notably establishing a strategic partnership with Tarter USA to develop and produce flex wing rotary cutters. Backing these industrial segments with wholesale credit and extended warranty programs gives Deere stable recurring cash flow across economic cycles. It remains a premier, tech-forward machinery powerhouse built for large-scale commercial farming and heavy earthmoving.

Key Financials
Market Cap
$183.05B
Revenue
$47.93B
EBITDA
$8.60B
Gross Margin
25.2%
Profit Margin
10.2%
Revenue Growth
4.9%
Total Cash
$6.94B
Total Debt
$64.58B
Free Cash Flow
$4.52B


52-Week Price Performance Analysis

Price Statistics
P/E Ratio
37.68
Forward P/E
29.72
Beta
0.91
52-Week High
$721.22
52-Week Low
$433.00
EPS
$18.02
50-Day Avg
$647.48
200-Day Avg
$586.88
Price/Book
6.54
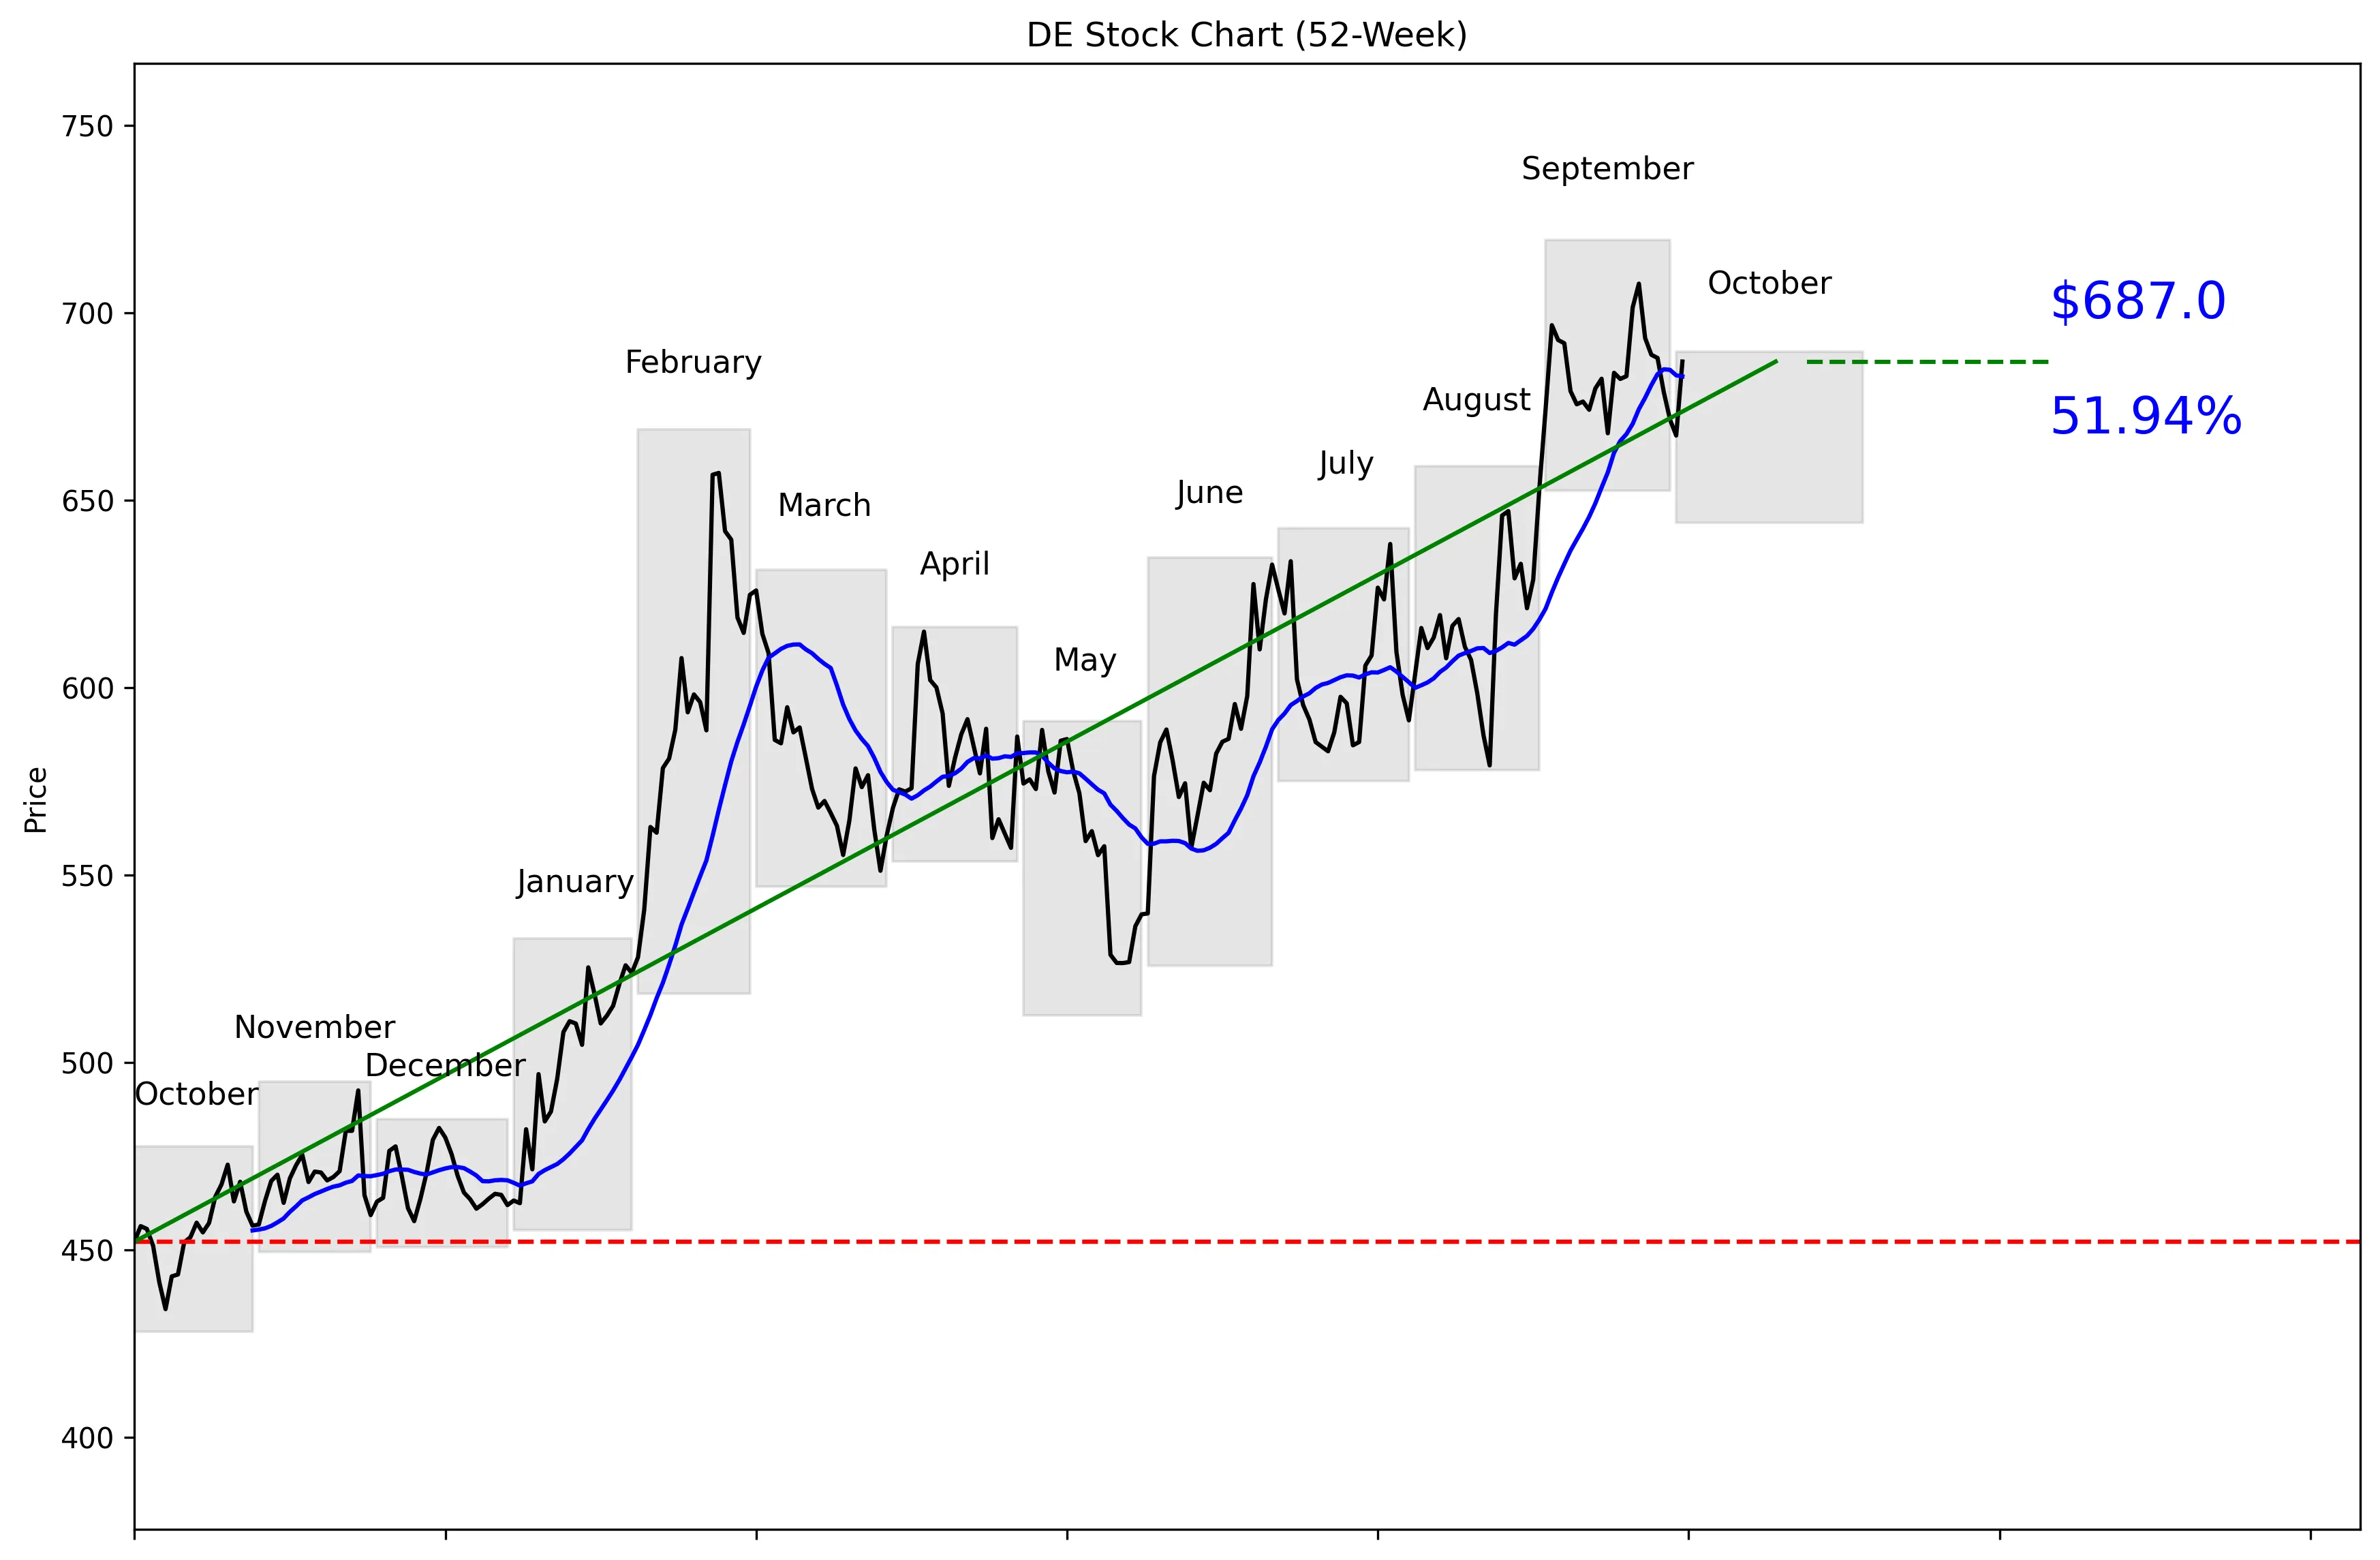
DE 52-Week Stock Chart
Technical Analysis
DE trades at $678.91, 89% of the way from its exact 52-week low of $428.12 to its exact high of $719.50. The stock is 4.52% below that high and 60.47% above the low, confirming a strong longer-term trend. Price is 0.58% below its 20-day moving average of $683.03. Momentum has weakened, with returns of -0.26% over five trading days and -0.83% over 20 trading days. Near-term support sits at $621.18, while $707.79 is the resistance level buyers need to clear.


Recent News and Developments

Deere jumps 2.96% and beats the broader market

Deere closed at $687.00 on October 2, up 2.96%, while the S&P 500 gained 0.73%. The stock remained down 3.91% over the previous month despite Friday’s rebound. Source: Zacks Equity Research

Construction strength offsets weaker farm-equipment demand

Deere reported that growth in construction and small equipment is offsetting softer results in its core agriculture business. That diversification is working, but weak large-equipment demand remains the key operating risk. Source: Simply Wall St

Analysts lean bullish, but earnings estimates are stuck

Deere’s average brokerage recommendation was 1.92 across 24 firms, with 12 Strong Buy ratings and two Buy ratings. The current-year consensus earnings estimate remained unchanged at $18.12, supporting Zacks’ more cautious Rank #3 Hold. Source: Zacks Equity Research


Market Sentiment and Analyst Recommendations

Bull Case
Deere generated $47.93 billion in revenue, and revenue growth remains positive at 4.9%. Construction and small equipment growth is offsetting weaker demand in the core agriculture business, proving the company is not dependent on one equipment category. The October 2 rebound to $687.00, a 2.96% gain against a 0.73% increase for the S&P 500, shows buyers will step in aggressively. Analysts remain bullish, with a buy recommendation from 23 analysts and an average target of $691.83. The high analyst target of $813.18 leaves meaningful upside if operating performance strengthens. The reason to buy is straightforward: Deere has positive growth, working diversification, and a stock still below both its $707.79 near-term resistance and $719.50 52-week high.
Bear Case
A P/E ratio of 37.68 is expensive for a company growing revenue by 4.9%. Deere also carries $64.58 billion in total debt against $6.94 billion in cash, leaving little room for operational disappointment. Demand for large agricultural equipment remains weak, and that is still Deere’s central operating risk. The stock is already 89% through its 52-week range and only 4.52% below its high, so much of the bullish case appears priced in. Current-year consensus earnings of $18.12 have not moved, despite bullish brokerage ratings, which explains the more cautious Zacks Rank #3 Hold. DE was also down 3.91% over the month before its October 2 rebound, while five-day and 20-day momentum remain negative.
What to Watch
The first test is whether DE can reclaim its 20-day moving average of $683.03 and hold above it. A break above $707.79 would clear the 30-day resistance level and put the $719.50 52-week high back in focus. A drop toward $621.18 would test the 30-day support level and weaken the current trend. Investors should watch whether construction and small equipment can continue offsetting soft large-equipment demand over the next quarter. Revenue growth needs to hold above the reported 4.9%, while the unchanged $18.12 current-year earnings estimate needs to start moving higher to justify a 37.68 P/E. Product execution also matters after Deere introduced the Z550R, Z560R and Z565R ZTrak mowers with its FlexGlide suspension system.
Analyst Consensus
BUY

Based on 23 analyst opinions
Low Target
$500.00
Mean Target
$691.83
High Target
$813.18


Earnings and Financial Data

Sector
Industrials
Industry
Farm & Heavy Construction Machinery
Employees
73,100
Earnings & Dividends
Next Earnings
Nov 25, 2026
EPS (Trailing)
$18.02
Dividend Yield
97.0%
Payout Ratio
36.0%

Frequently Asked Questions

Is DE a good stock to buy?
The consensus recommendation is buy across 23 analysts, and revenue is growing 4.9%. However, the stock trades at a P/E of 37.68 and sits 89% through its 52-week range, so the takeaway is that DE has support from analysts but is not cheap.
What is DE’s price target?
The average analyst target is $691.83, with estimates ranging from $500.00 to $813.18. The takeaway is that Wall Street’s expectations vary widely around the current $678.91 price.
What are DE’s support and resistance levels?
Near-term support is the 30-day low of $621.18, while near-term resistance is the 30-day high of $707.79. The takeaway is that those are the key levels for judging DE’s next move.
Is DE near its 52-week high?
DE is 4.52% below its exact 52-week high of $719.50 and 60.47% above its exact low of $428.12. The takeaway is that the stock is trading near the top of its 52-week range.
Does DE pay a dividend?
The provided data does not include Deere’s dividend or dividend yield. The takeaway is that no dividend conclusion can be made from this dataset.

Related Stock Reports

Disclaimer: This report is for informational purposes only and does not constitute financial advice. The analysis and opinions expressed are those of AltStation.io and should not be relied upon as the sole basis for investment decisions. Always conduct your own research and consult with a qualified financial advisor before making investment decisions. Past performance does not guarantee future results. Updated October 04, 2026.