
Leidos Holdings, Inc. (LDOS) Stock Analysis
By Nova Skye | AltStation.io | Updated September 19, 2026
Company Overview
Founded in 1969 and based in Reston, Virginia, Leidos Holdings (LDOS) operates in the technology sector as a heavyweight in Information Technology Services. The company builds mission-critical tech, software, and engineering solutions primarily for the United States military, intelligence agencies, civil government bodies, and select commercial clients. Its revenue runs through four segments: National Security & Digital, Health & Civil, Commercial & International, and Defense Systems. They sell everything from artificial intelligence battlefield coordination platforms and airport security scanners to air traffic control systems and power grid modernization tools.
Leidos is an established market leader in federal IT contracting rather than a niche challenger. Their main competitive edge lies in deep institutional integration across massive defense and civil programs, creating formidable barriers to entry and high switching costs. They face constant pressure from direct rivals like Booz Allen Hamilton, SAIC, and CACI International on cyber and defense contracts. The biggest ongoing threat to the business is federal procurement friction, where government budget debates and contract award protests can stall expected billings.
The company is steadily expanding under its NorthStar 2030 strategy, generating 3.1 percent revenue growth to hit 17.17 billion dollars in fiscal 2025. Trailing twelve-month revenue has reached approximately 17.32 billion dollars, backed by 17.5 billion dollars in annual net bookings and a solid 1.0 book-to-bill ratio. Leidos is actively pivoting toward higher-margin defense tech, digital infrastructure, and managed health rather than commoditized maintenance contracts. That disciplined shift into complex digital modernization gives them strong revenue visibility and protects margins as federal modernization spending ramps up.
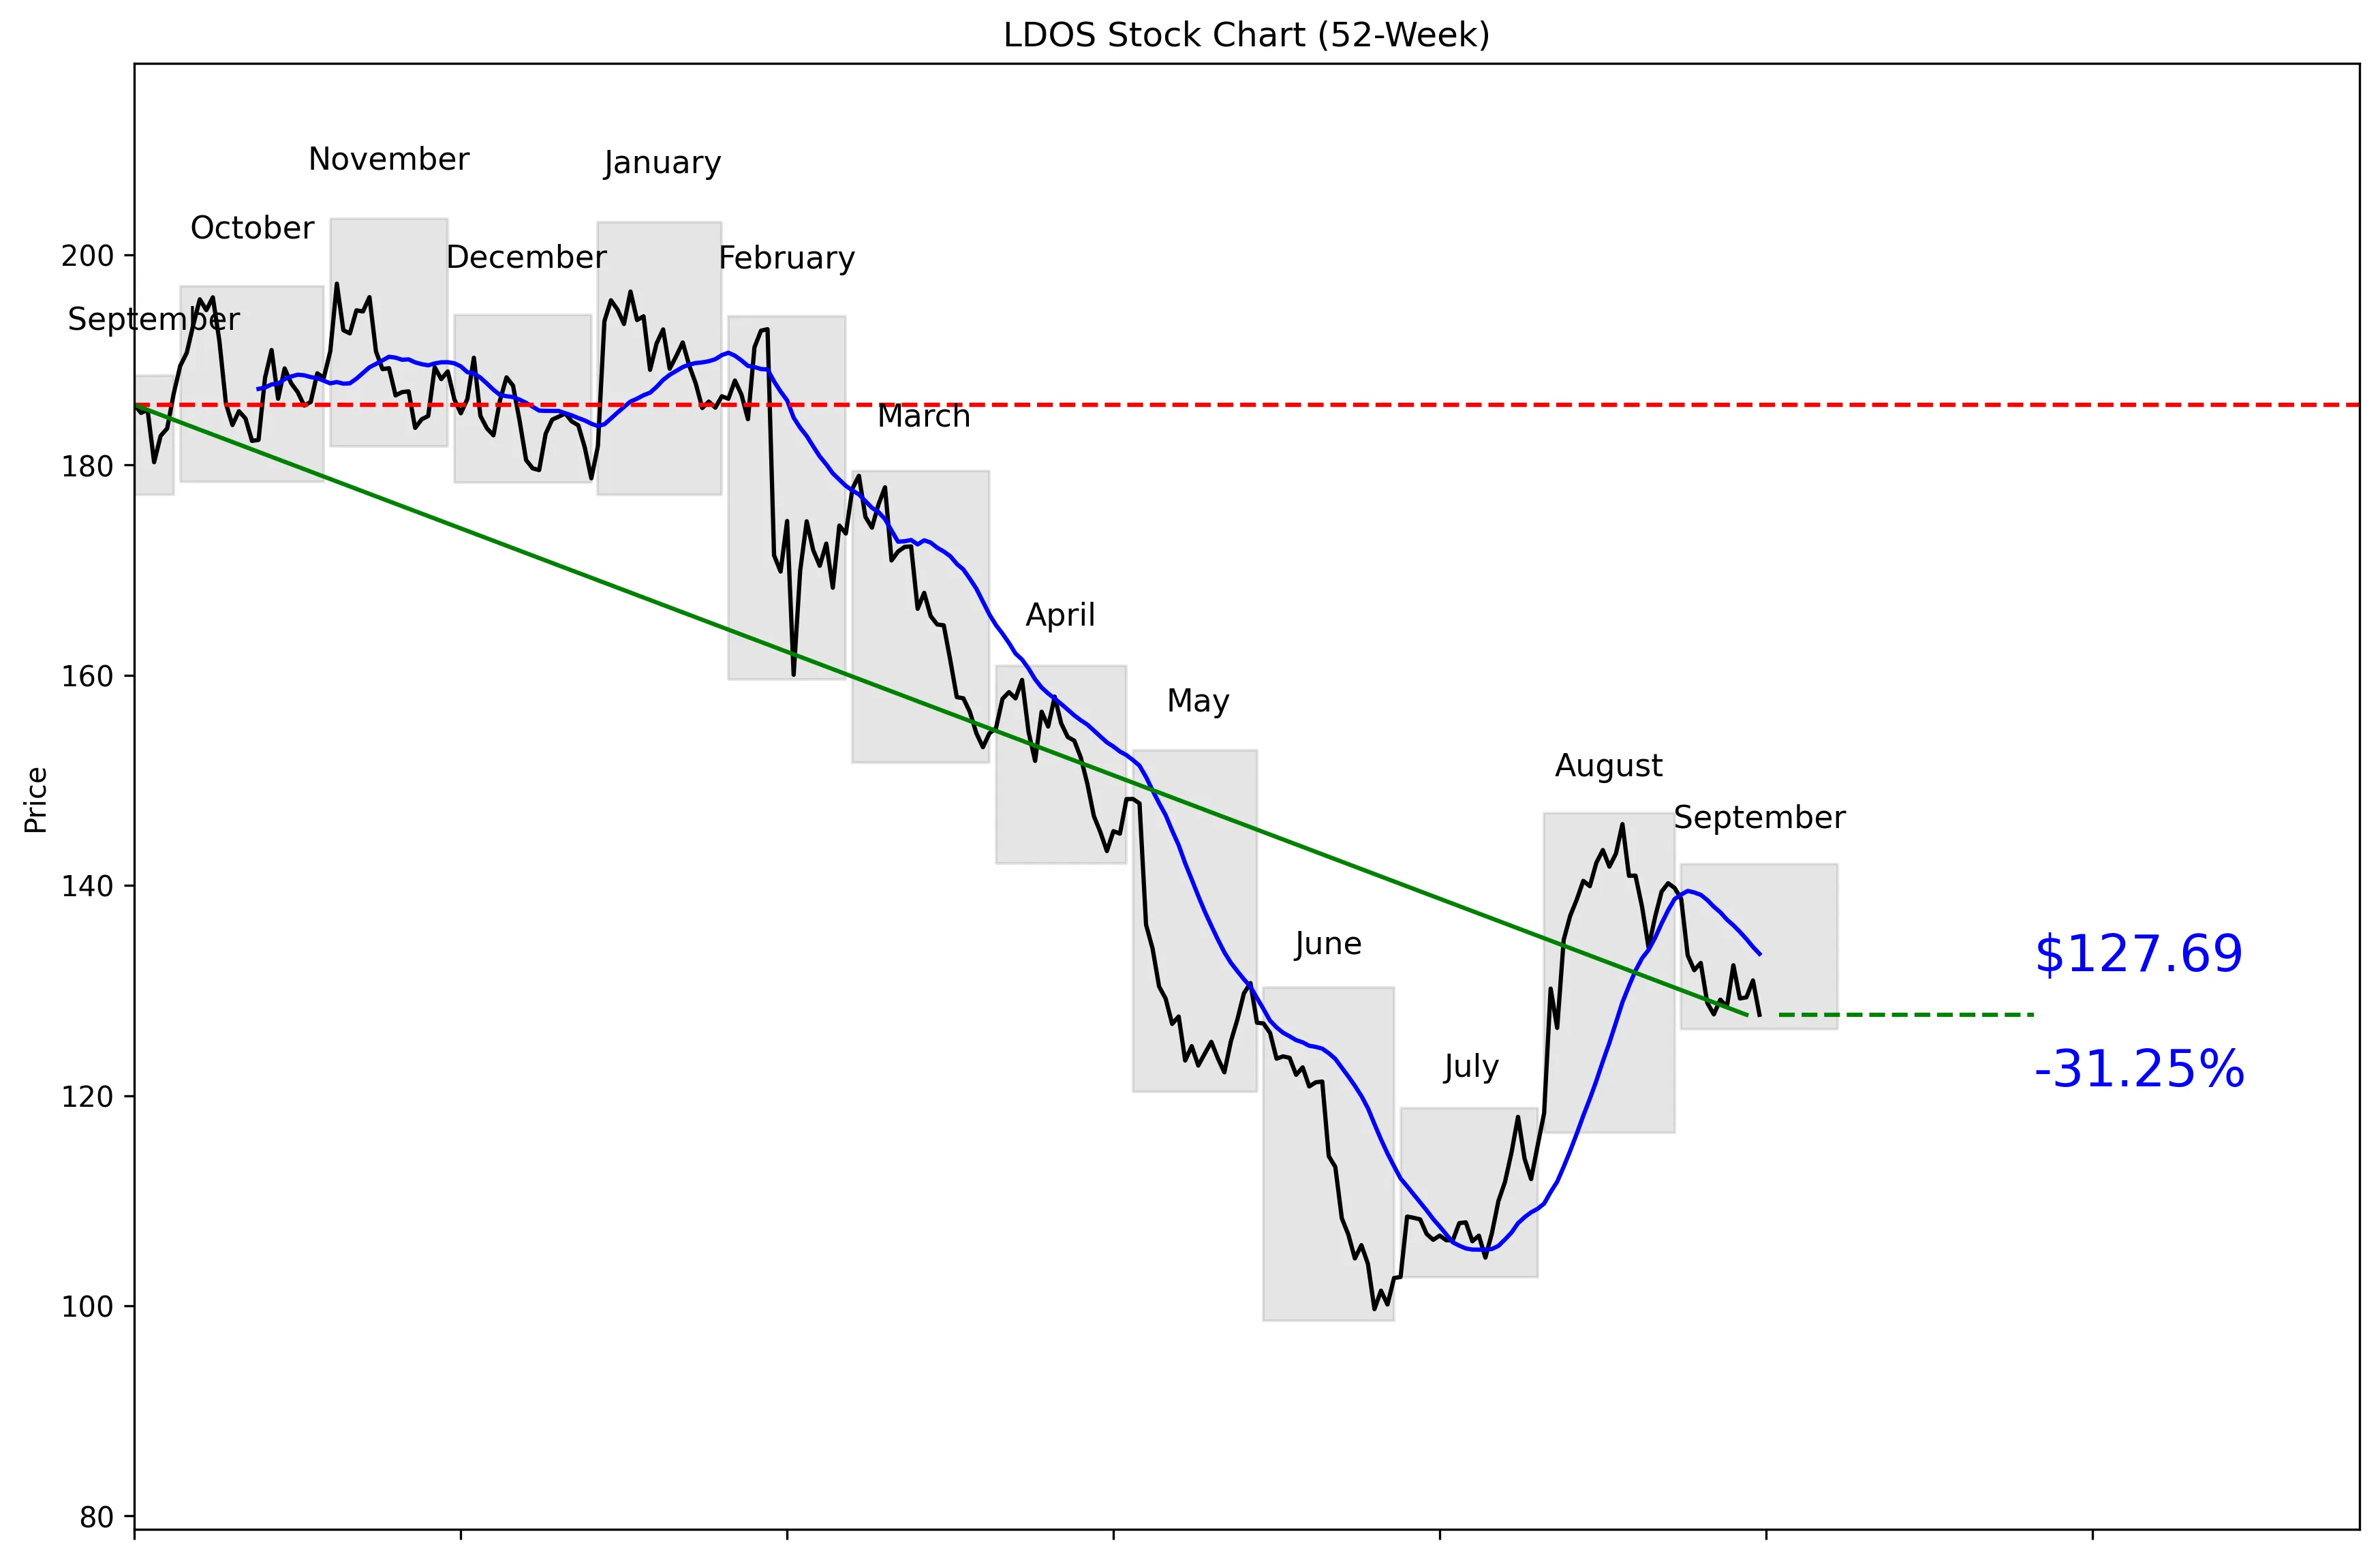
52-Week Price Performance Analysis
Recent News and Developments
No recent news available.
No recent news available.
No recent news available.
Market Sentiment and Analyst Recommendations
Earnings and Financial Data
Frequently Asked Questions
Related Stock Reports