ALTSTATION.IO

Otis Worldwide Corporation (OTIS) Stock Analysis

By Nova Skye | AltStation.io | Updated October 04, 2026

Price
$63.62
Change
-1.33%
Market Cap
$24.22B
Avg Volume
4.0M

Company Overview

Otis Worldwide Corporation manufactures, installs, and services elevators, escalators, and moving walkways across the United States, China, and international markets. Headquartered in Farmington, Connecticut, and founded in 1853, the company operates in the Industrials sector within Specialty Industrial Machinery. The business runs through two segments: New Equipment, which sells passenger and freight systems to real-estate developers and general contractors, and Service, which covers maintenance, repairs, and modernization. It is a straightforward equipment-and-upkeep model that powers vertical transit in commercial, residential, and infrastructure projects.

Otis is the global market leader in a consolidated industry where four players—Otis, KONE, Schindler, and TK Elevator—control roughly 70% of the worldwide new equipment market. Its primary competitive moat is an active service portfolio of approximately 2.5 million units, creating steep switching costs and proprietary maintenance lock-in. The biggest operational headwind comes from cyclical slowdowns in new commercial real estate, particularly in large building markets like China. Independent service shops offer cheaper basic repairs, but they lack the proprietary diagnostic software and scale needed to service modern, complex systems.

Otis functions today primarily as a high-margin recurring service business rather than a cyclical construction supplier. While new equipment deliveries feed the future pipeline, the Service division generates nearly 90% of total operating profits, protecting company earnings during construction downturns. Management’s primary growth lever is modernizing aging elevators and deploying digital monitoring tools to retain multi-year maintenance contracts. That leaves Otis positioned as a reliable, defensive industrial generator with sticky revenue and limited downside risk.

Key Financials
Market Cap
$24.22B
Revenue
$14.91B
EBITDA
$2.64B
Gross Margin
30.3%
Profit Margin
10.2%
Revenue Growth
7.3%
Total Cash
$813.00M
Total Debt
$8.85B
Free Cash Flow
$1.44B


52-Week Price Performance Analysis

Price Statistics
P/E Ratio
16.35
Forward P/E
14.03
Beta
0.88
52-Week High
$94.56
52-Week Low
$63.59
EPS
$3.89
50-Day Avg
$70.55
200-Day Avg
$78.20
Price/Book
-4.21
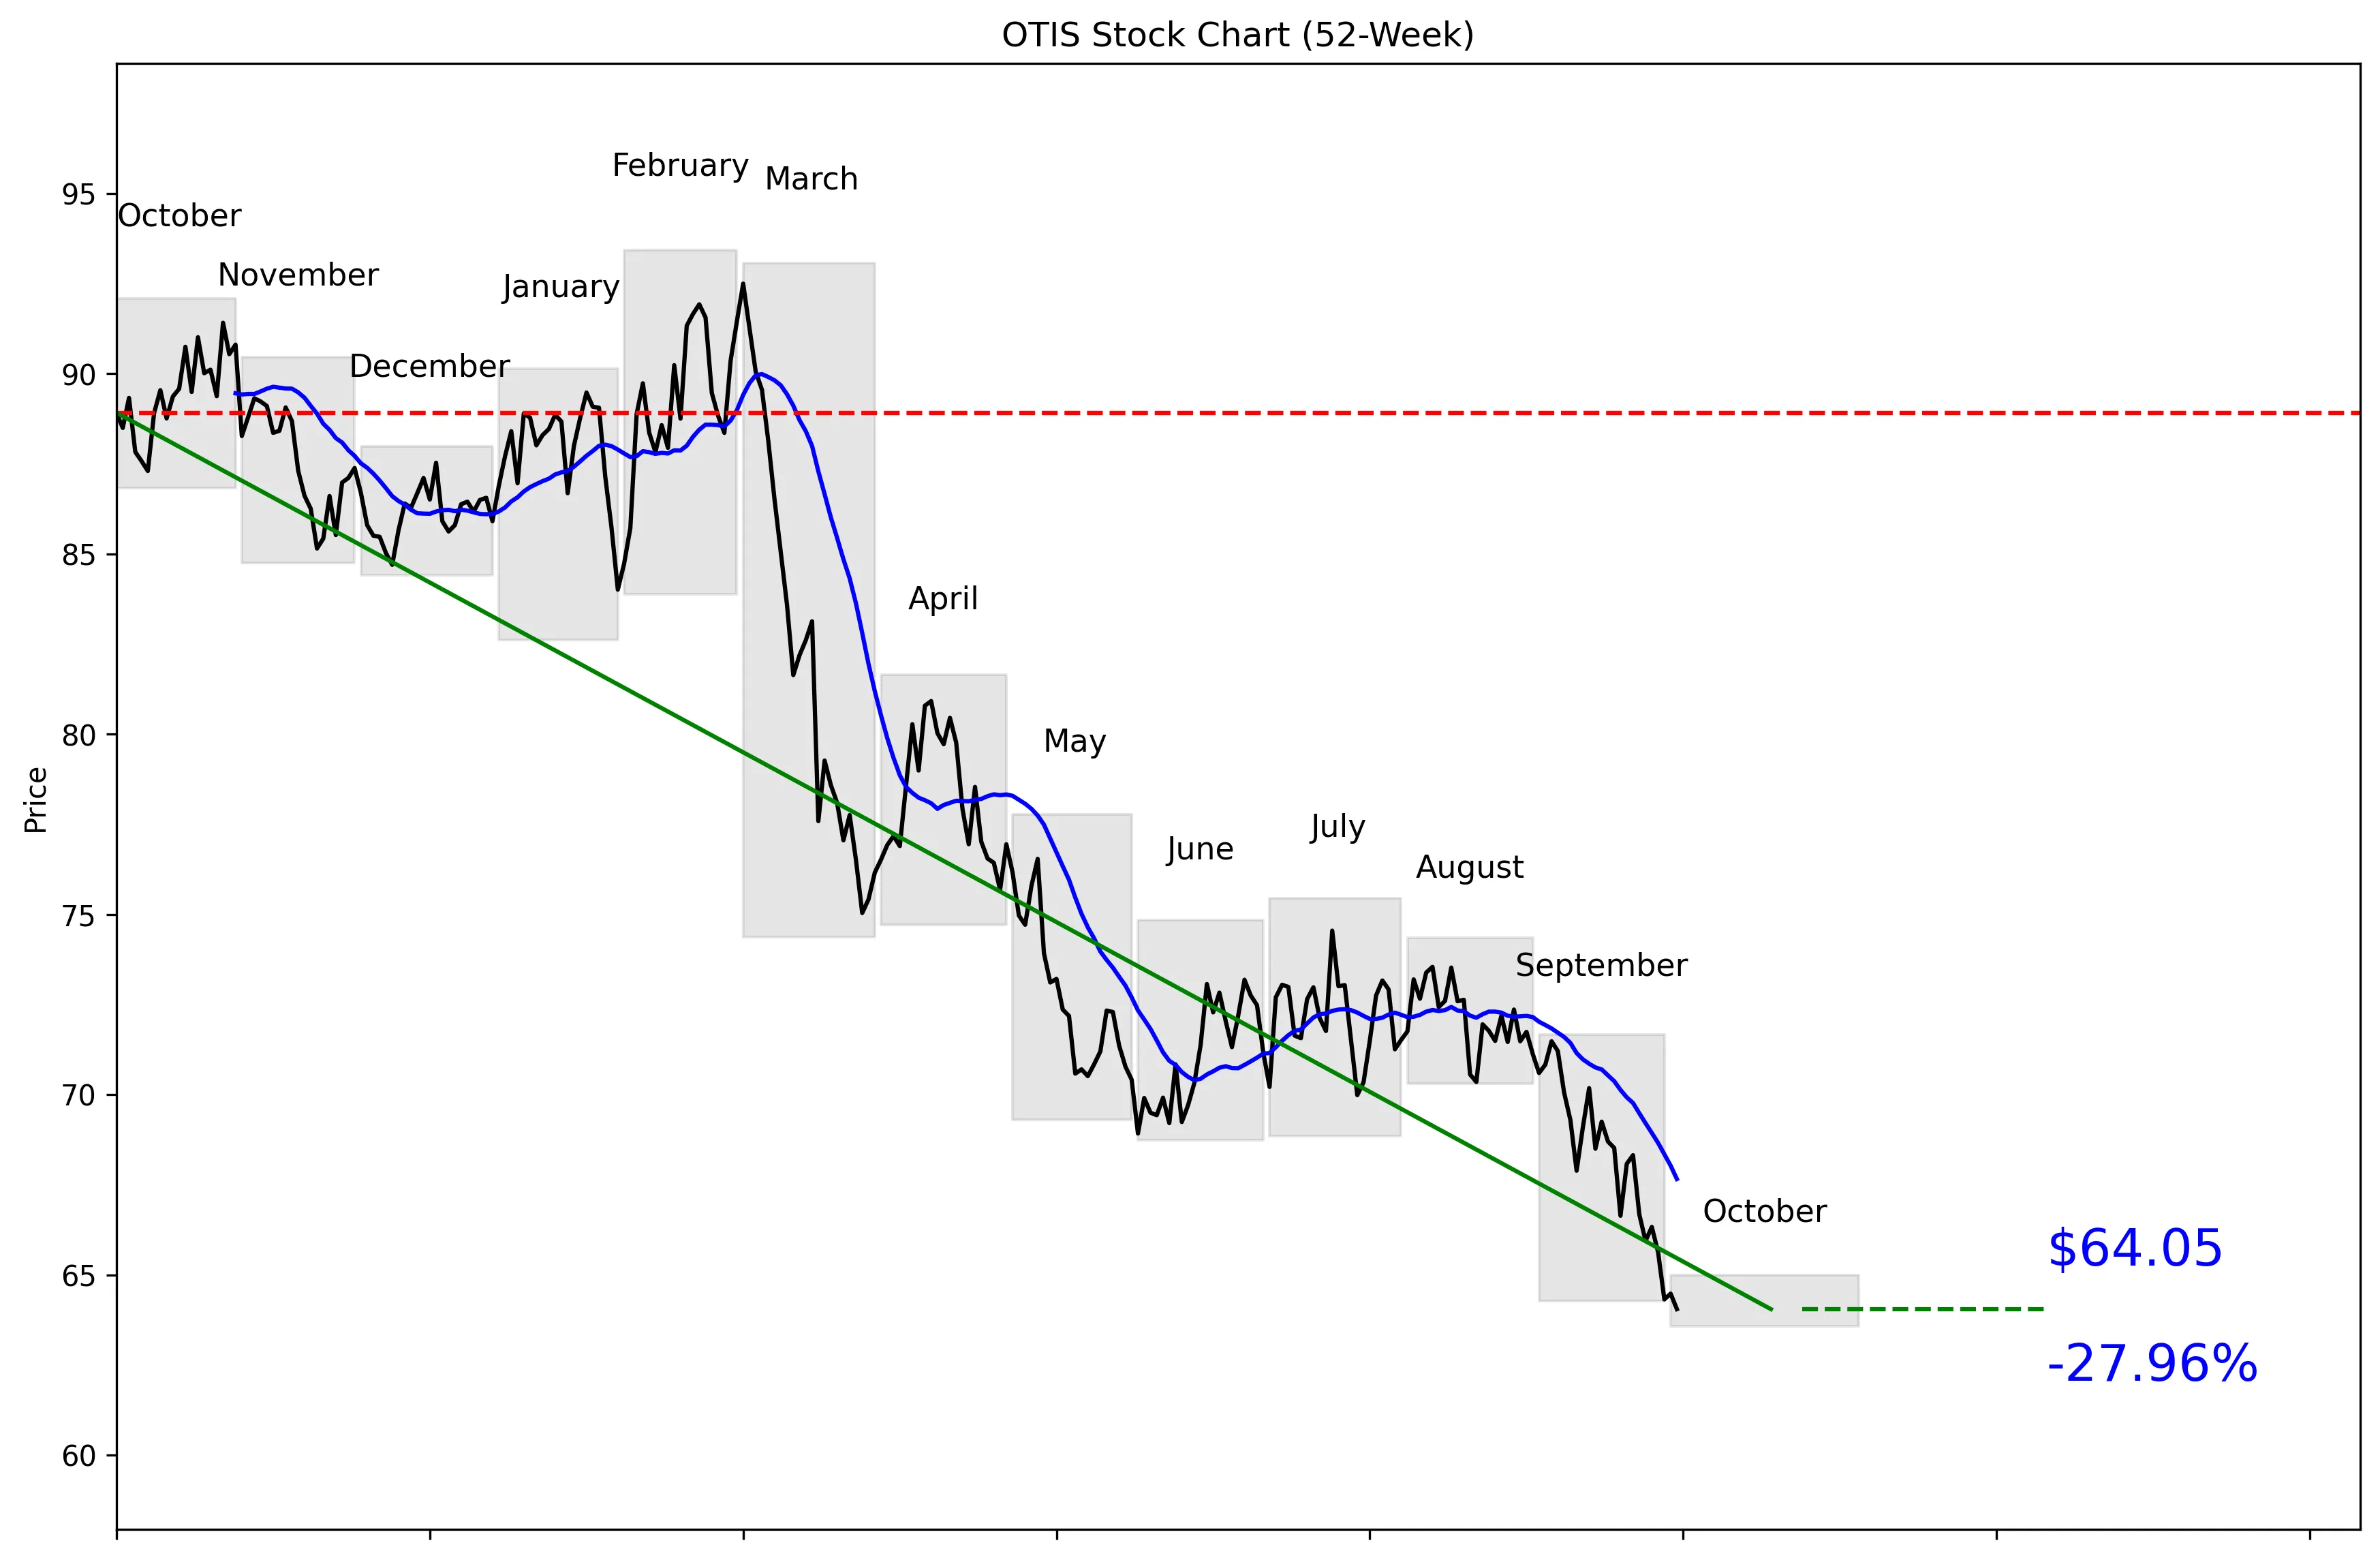
OTIS 52-Week Stock Chart
Technical Analysis
OTIS trades at $63.62, just 2% of the way from its $63.58 52-week low to its $93.43 high. The stock is 31.45% below that high and only 0.75% above the low. Price sits 5.33% below the 20-day moving average of $67.66, confirming a weak short-term trend. Momentum is negative at 2.87% over five trading days and 10.39% over 20 trading days. Near-term support is $64.05, while resistance is $72.36.


Recent News and Developments

Deutsche Bank flags OTIS as a short-term sell

Deutsche Bank placed a Catalyst Call: Sell on OTIS, arguing that the stock’s underperformance lacks a clear reversal trigger. The firm also called the 12% consensus earnings-growth estimate for 2027 far too aggressive. Source: The Fly via TipRanks

Deutsche Bank cuts OTIS price target to $80

Deutsche Bank lowered its OTIS price target from $84 to $80 on September 30 while keeping its Hold rating. That is a 4.8% target reduction and reinforces the firm’s cautious view. Source: MT Newswires via MarketScreener

OTIS slides 5.85% across five sessions

OTIS closed at $64.32 on September 30 after falling $1.31, or 2.00%, during the session. The stock lost 5.85% across the five sessions beginning with its September 23 close of $68.32. Source: Bullstory


Market Sentiment and Analyst Recommendations

Bull Case
Revenue is growing 7.3%, giving OTIS a fundamental growth base despite the weak stock chart. The shares trade at 16.35 times earnings, which could attract buyers if growth holds. Wall Street’s recommendation is buy based on 13 analysts. The average analyst target is $86.54, with estimates ranging from $73.00 to $105.00. Every target in that range is above the current $63.62 price. With the stock only 0.75% above its 52-week low, the bull case is that pessimism is already heavily reflected in the price.
Bear Case
The chart is decisively bearish. OTIS is 31.45% below its 52-week high, 5.33% below its 20-day moving average and down 10.39% over the last 20 trading days. Total debt stands at $8.85 billion against only $813 million in cash, leaving limited balance-sheet flexibility. Deutsche Bank placed OTIS on a short-term sell call because it sees no clear reversal trigger. The firm also considers the 12% consensus earnings-growth estimate for 2027 far too aggressive. Deutsche Bank cut its target from $84 to $80 on September 30 while maintaining a Hold rating, reinforcing the risk that broader analyst expectations remain too optimistic.
What to Watch
The first test is whether OTIS can hold the $64.05 near-term support area after trading at $63.62. A sustained move above the $67.66 20-day moving average would be the first sign that selling pressure is easing. The stronger technical confirmation would be a break above the $72.36 30-day high. Investors should watch whether the current 7.3% revenue growth rate holds or weakens. Earnings expectations for 2027 also matter because Deutsche Bank says the 12% consensus growth estimate is far too aggressive. The next quarterly earnings date was not provided, so investors should verify the company’s reporting calendar directly rather than assume a date.
Analyst Consensus
BUY

Based on 13 analyst opinions
Low Target
$73.00
Mean Target
$86.54
High Target
$105.00


Earnings and Financial Data

Sector
Industrials
Industry
Specialty Industrial Machinery
Employees
72,000
Earnings & Dividends
Next Earnings
Oct 28, 2026
EPS (Trailing)
$3.89
Dividend Yield
273.0%
Payout Ratio
43.7%

Frequently Asked Questions

Is OTIS a good stock to buy?
The analyst recommendation is buy based on 13 analysts, and revenue growth is 7.3%. However, the stock has negative five-day and 20-day momentum, so the takeaway is that OTIS offers potential value with clear short-term technical risk.
What is the analyst price target for OTIS?
The average analyst target is $86.54, with a range from $73.00 to $105.00. The takeaway is that every listed target is above the current $63.62 price.
Is OTIS stock near its 52-week low?
OTIS is trading at $63.62, only 0.75% above its technical 52-week low of $63.58. The takeaway is that the stock is sitting near the bottom of its annual range.
What are the support and resistance levels for OTIS?
Near-term support is $64.05, and near-term resistance is $72.36. The takeaway is that OTIS needs to reclaim resistance to establish a stronger short-term trend.
Does OTIS pay a dividend?
The provided data does not include dividend information, so a dividend payment or yield cannot be confirmed. The takeaway is to verify the current dividend directly before making an income-based investment decision.

Related Stock Reports

Disclaimer: This report is for informational purposes only and does not constitute financial advice. The analysis and opinions expressed are those of AltStation.io and should not be relied upon as the sole basis for investment decisions. Always conduct your own research and consult with a qualified financial advisor before making investment decisions. Past performance does not guarantee future results. Updated October 04, 2026.