ALTSTATION.IO

Tesla, Inc. (TSLA) Stock Analysis

By Nova Skye | AltStation.io | Updated September 19, 2026

Price
$352.18
Change
-6.43%
Market Cap
$1.39T
Avg Volume
41.8M

Company Overview

Tesla, Inc. designs and manufactures electric vehicles (EVs) and energy solutions, including solar panels and battery storage systems. Their product lineup includes popular models like the Model S, Model 3, Model X, and Model Y, appealing to consumers and businesses looking for sustainable energy options. They also offer services like automotive insurance, maintenance, and sales of accessories and parts, leveraging a direct sales model that bypasses traditional dealerships.

Tesla is the market leader in the EV space, holding about 60% of the U.S. electric car market share as of late 2023. Their brand strength, cutting-edge technology, and extensive Supercharger network give them a significant competitive edge. However, they face increasing competition from established automakers like Ford and GM, as well as new entrants like Rivian and Lucid Motors. These competitors are ramping up EV production and innovation, which could challenge Tesla’s dominance in the sector.

Currently, Tesla is in a phase of rapid growth. The company continues to expand production capacity with new Gigafactories, including a recent one in Austin. They are streamlining operations and pursuing aggressive cost-cutting measures to enhance profitability. Recent milestones, such as a record quarterly production and delivery figures, indicate strong demand but also highlight the pressure to maintain growth amid intensifying competition.

Key Financials
Market Cap
$1.39T
Revenue
$103.62B
EBITDA
$10.76B
Gross Margin
18.9%
Profit Margin
3.7%
Revenue Growth
25.5%
Total Cash
$43.52B
Total Debt
$16.08B
Free Cash Flow
$4.84B


52-Week Price Performance Analysis

Price Statistics
P/E Ratio
323.10
Forward P/E
163.15
Beta
1.84
52-Week High
$498.83
52-Week Low
$297.38
EPS
$1.09
50-Day Avg
$358.37
200-Day Avg
$399.83
Price/Book
16.01
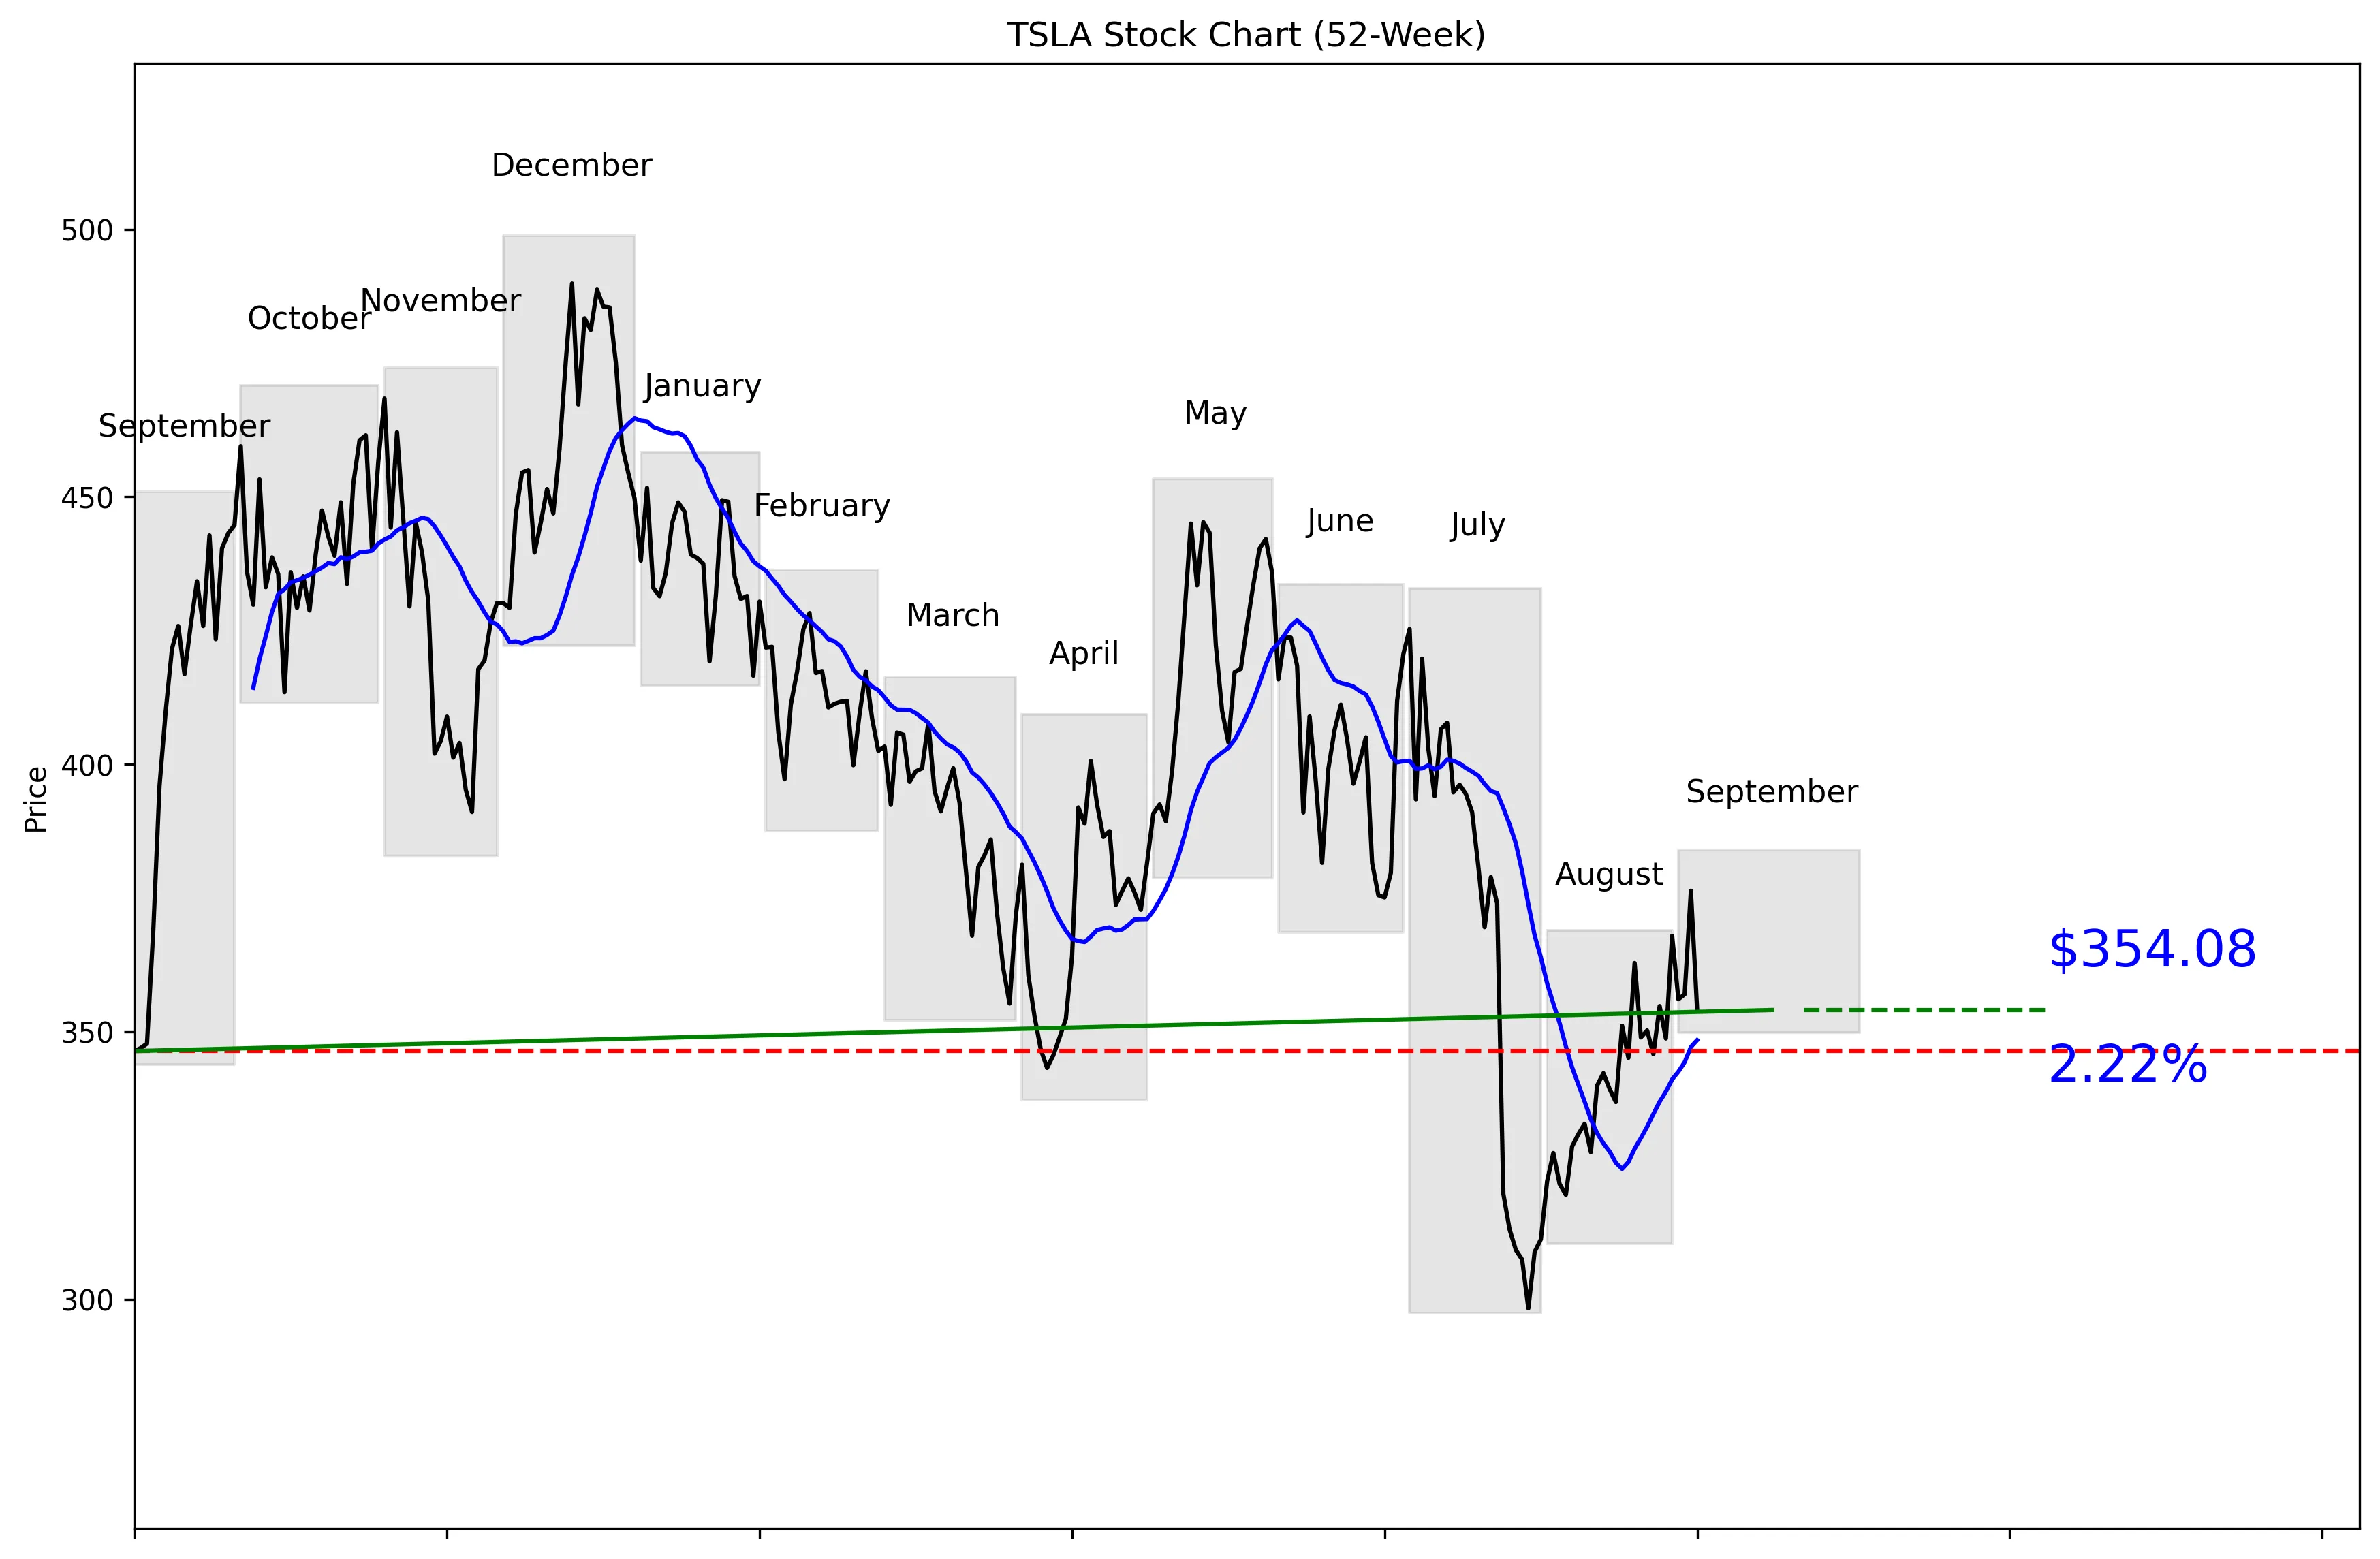
TSLA 52-Week Stock Chart
Technical Analysis
TSLA trades at $352.18, down 29.02% from its $498.83 52-week high and up 19.07% from its $297.38 low. The stock sits just 28% of the way from the low to the high, so it remains in the lower portion of its annual range. Price is 1.62% above the 20-day moving average of $348.44. Momentum is positive at 1.53% over five trading days and 7.76% over 20 trading days. Near-term support is $298.32, while $376.37 is the resistance level buyers need to clear.


Recent News and Developments

Tesla launches Cybercab rides in Austin

Tesla began offering Cybercab rides in limited areas of Austin on September 3. The two-seat vehicle operates without a steering wheel or pedals, marking its commercial debut. Source: Reuters

NHTSA opens Cybercab safety probe

Federal regulators opened an investigation into whether Tesla’s Cybercab complies with safety rules for vehicles operating without steering wheels, mirrors, or brake pedals. NHTSA will audit the technical data Tesla used to self-certify the vehicle. Source: Associated Press

Tesla drops 5.92% after Cybercab launch

TSLA fell $22.29, or 5.92%, to $354.08 on September 4 as investors reacted to the Cybercab event and federal scrutiny. The shares traded between $351.32 and $364.69 during the session. Source: The Motley Fool


Market Sentiment and Analyst Recommendations

Bull Case
Tesla generated $103.62 billion in revenue, with revenue growth running at 25.5%. That growth rate is the strongest fundamental reason to own the stock. The balance sheet also provides flexibility, with $43.52 billion in cash against $16.08 billion in debt. Cybercab began commercial rides in limited areas of Austin on September 3, giving investors a real deployment to track rather than another concept announcement. The consensus recommendation is buy across 38 analysts, with a $387.73 target versus the current $352.18 price. StoneX is more bullish with a $475 target, and the stock’s 7.76% 20-day momentum shows buyers have recently regained control.
Bear Case
The P/E ratio of 323.10 is the central problem with the Tesla thesis. That valuation leaves little room for weak growth, regulatory trouble, or disappointing execution. Cybercab immediately attracted federal scrutiny, with NHTSA investigating whether the vehicle complies with safety rules despite lacking steering wheels, mirrors, and brake pedals. Investors responded harshly on September 4, sending TSLA down 5.92% to $354.08 after the launch and regulatory news. Analysts also disagree dramatically: the broader target range runs from $125.00 to $600.00, while GLJ Research has a Sell rating and a $24.86 target. With the shares still 29.02% below their 52-week high, the market is clearly unwilling to give Tesla full credit for the Cybercab story yet.
What to Watch
Cybercab’s limited Austin rollout, which began September 3, is the most important operating catalyst over the next quarter. Investors need concrete details on fleet size, pricing, ordering, and broader deployment because those details were not provided in the supplied news. NHTSA’s audit of Tesla’s self-certification data is the biggest near-term risk and could determine whether the rollout expands cleanly. On the chart, a move above $376.37 would break the current 30-day resistance level and strengthen the bullish setup. A drop below the $348.44 20-day moving average would weaken momentum, while $298.32 is the key near-term support threshold. Fundamentally, investors should track whether the reported 25.5% revenue growth can justify a P/E of 323.10.
Analyst Consensus
BUY

Based on 38 analyst opinions
Low Target
$125.00
Mean Target
$387.73
High Target
$600.00


Earnings and Financial Data

Sector
Consumer Cyclical
Industry
Auto Manufacturers
Employees
134,785
Earnings & Dividends
Next Earnings
Oct 21, 2026
EPS (Trailing)
$1.09
Dividend Yield
None
Payout Ratio
0%

Frequently Asked Questions

Is TSLA a good stock to buy?
The consensus recommendation is buy based on 38 analysts, and revenue growth is 25.5%. The clear takeaway is that analysts favor the stock, but its 323.10 P/E demands strong execution.
What is TSLA’s analyst price target?
The analyst target is $387.73, with estimates ranging from $125.00 to $600.00. The takeaway is that the average target sits above the $352.18 share price, but expectations vary widely.
Is TSLA stock overvalued?
TSLA trades at a P/E ratio of 323.10 while generating $103.62 billion in revenue. The takeaway is that the valuation is aggressive and requires continued growth.
What are TSLA’s support and resistance levels?
Near-term support is the 30-day low of $298.32, while resistance is the 30-day high of $376.37. The takeaway is that these are the key levels defining the current trading range.
How far is TSLA from its 52-week high?
TSLA is 29.02% below its $498.83 52-week high and 19.07% above its $297.38 low. The takeaway is that the stock remains much closer to its annual low than its high.

Related Stock Reports

Disclaimer: This report is for informational purposes only and does not constitute financial advice. The analysis and opinions expressed are those of AltStation.io and should not be relied upon as the sole basis for investment decisions. Always conduct your own research and consult with a qualified financial advisor before making investment decisions. Past performance does not guarantee future results. Updated September 19, 2026.