ALTSTATION.IO

The Trade Desk, Inc. (TTD) Stock Analysis

By Nova Skye | AltStation.io | Updated September 09, 2026

Price
$13.96
Change
-0.39%
Market Cap
$6.56B
Avg Volume
22.0M

Company Overview

The Trade Desk, Inc. operates a software platform that lets advertisers buy and optimize digital ad space across connected TV, video, audio, display, and digital billboards. Founded in 2009 and headquartered in Ventura, California, the company sits in the Communication Services sector within the Advertising Agencies industry. Rather than selling ad inventory itself, it sells programmatic buying tools and data services directly to ad agencies and commercial advertisers. The platform executes campaigns across smartphones, computers, and streaming television devices globally.

The company holds the dominant position as the leading independent demand-side platform in digital advertising. Its core competitive edge is neutrality: because it owns no media inventory or streaming networks, it eliminates the direct conflicts of interest built into walled-garden platforms. Its primary threats are tech giants like Google, Meta, and Amazon, which dominate digital ad budgets through their proprietary ecosystems. For any brand that wants serious scale across the open internet without routing spend through Google, The Trade Desk remains the clear go-to option.

The business continues to expand rapidly, generating $2.44 billion in revenue in 2024, a 26% increase year over year. That built on 23% top-line growth in 2023, when full-year revenue reached $1.95 billion. Momentum is driven by the ongoing shift of linear television ad spend to Connected TV and the deployment of the company’s upgraded Kokai buying platform. Despite periodic pullbacks in broader brand advertising spend, The Trade Desk consistently takes market share and outperforms the wider ad industry.

Key Financials
Market Cap
$6.56B
Revenue
$2.99B
EBITDA
$697.98M
Gross Margin
76.9%
Profit Margin
13.6%
Revenue Growth
3.0%
Total Cash
$1.49B
Total Debt
$434.11M
Free Cash Flow
$582.99M


52-Week Price Performance Analysis

Price Statistics
P/E Ratio
16.62
Forward P/E
13.88
Beta
1.00
52-Week High
$56.39
52-Week Low
$12.83
EPS
$0.84
50-Day Avg
$16.49
200-Day Avg
$24.90
Price/Book
2.68
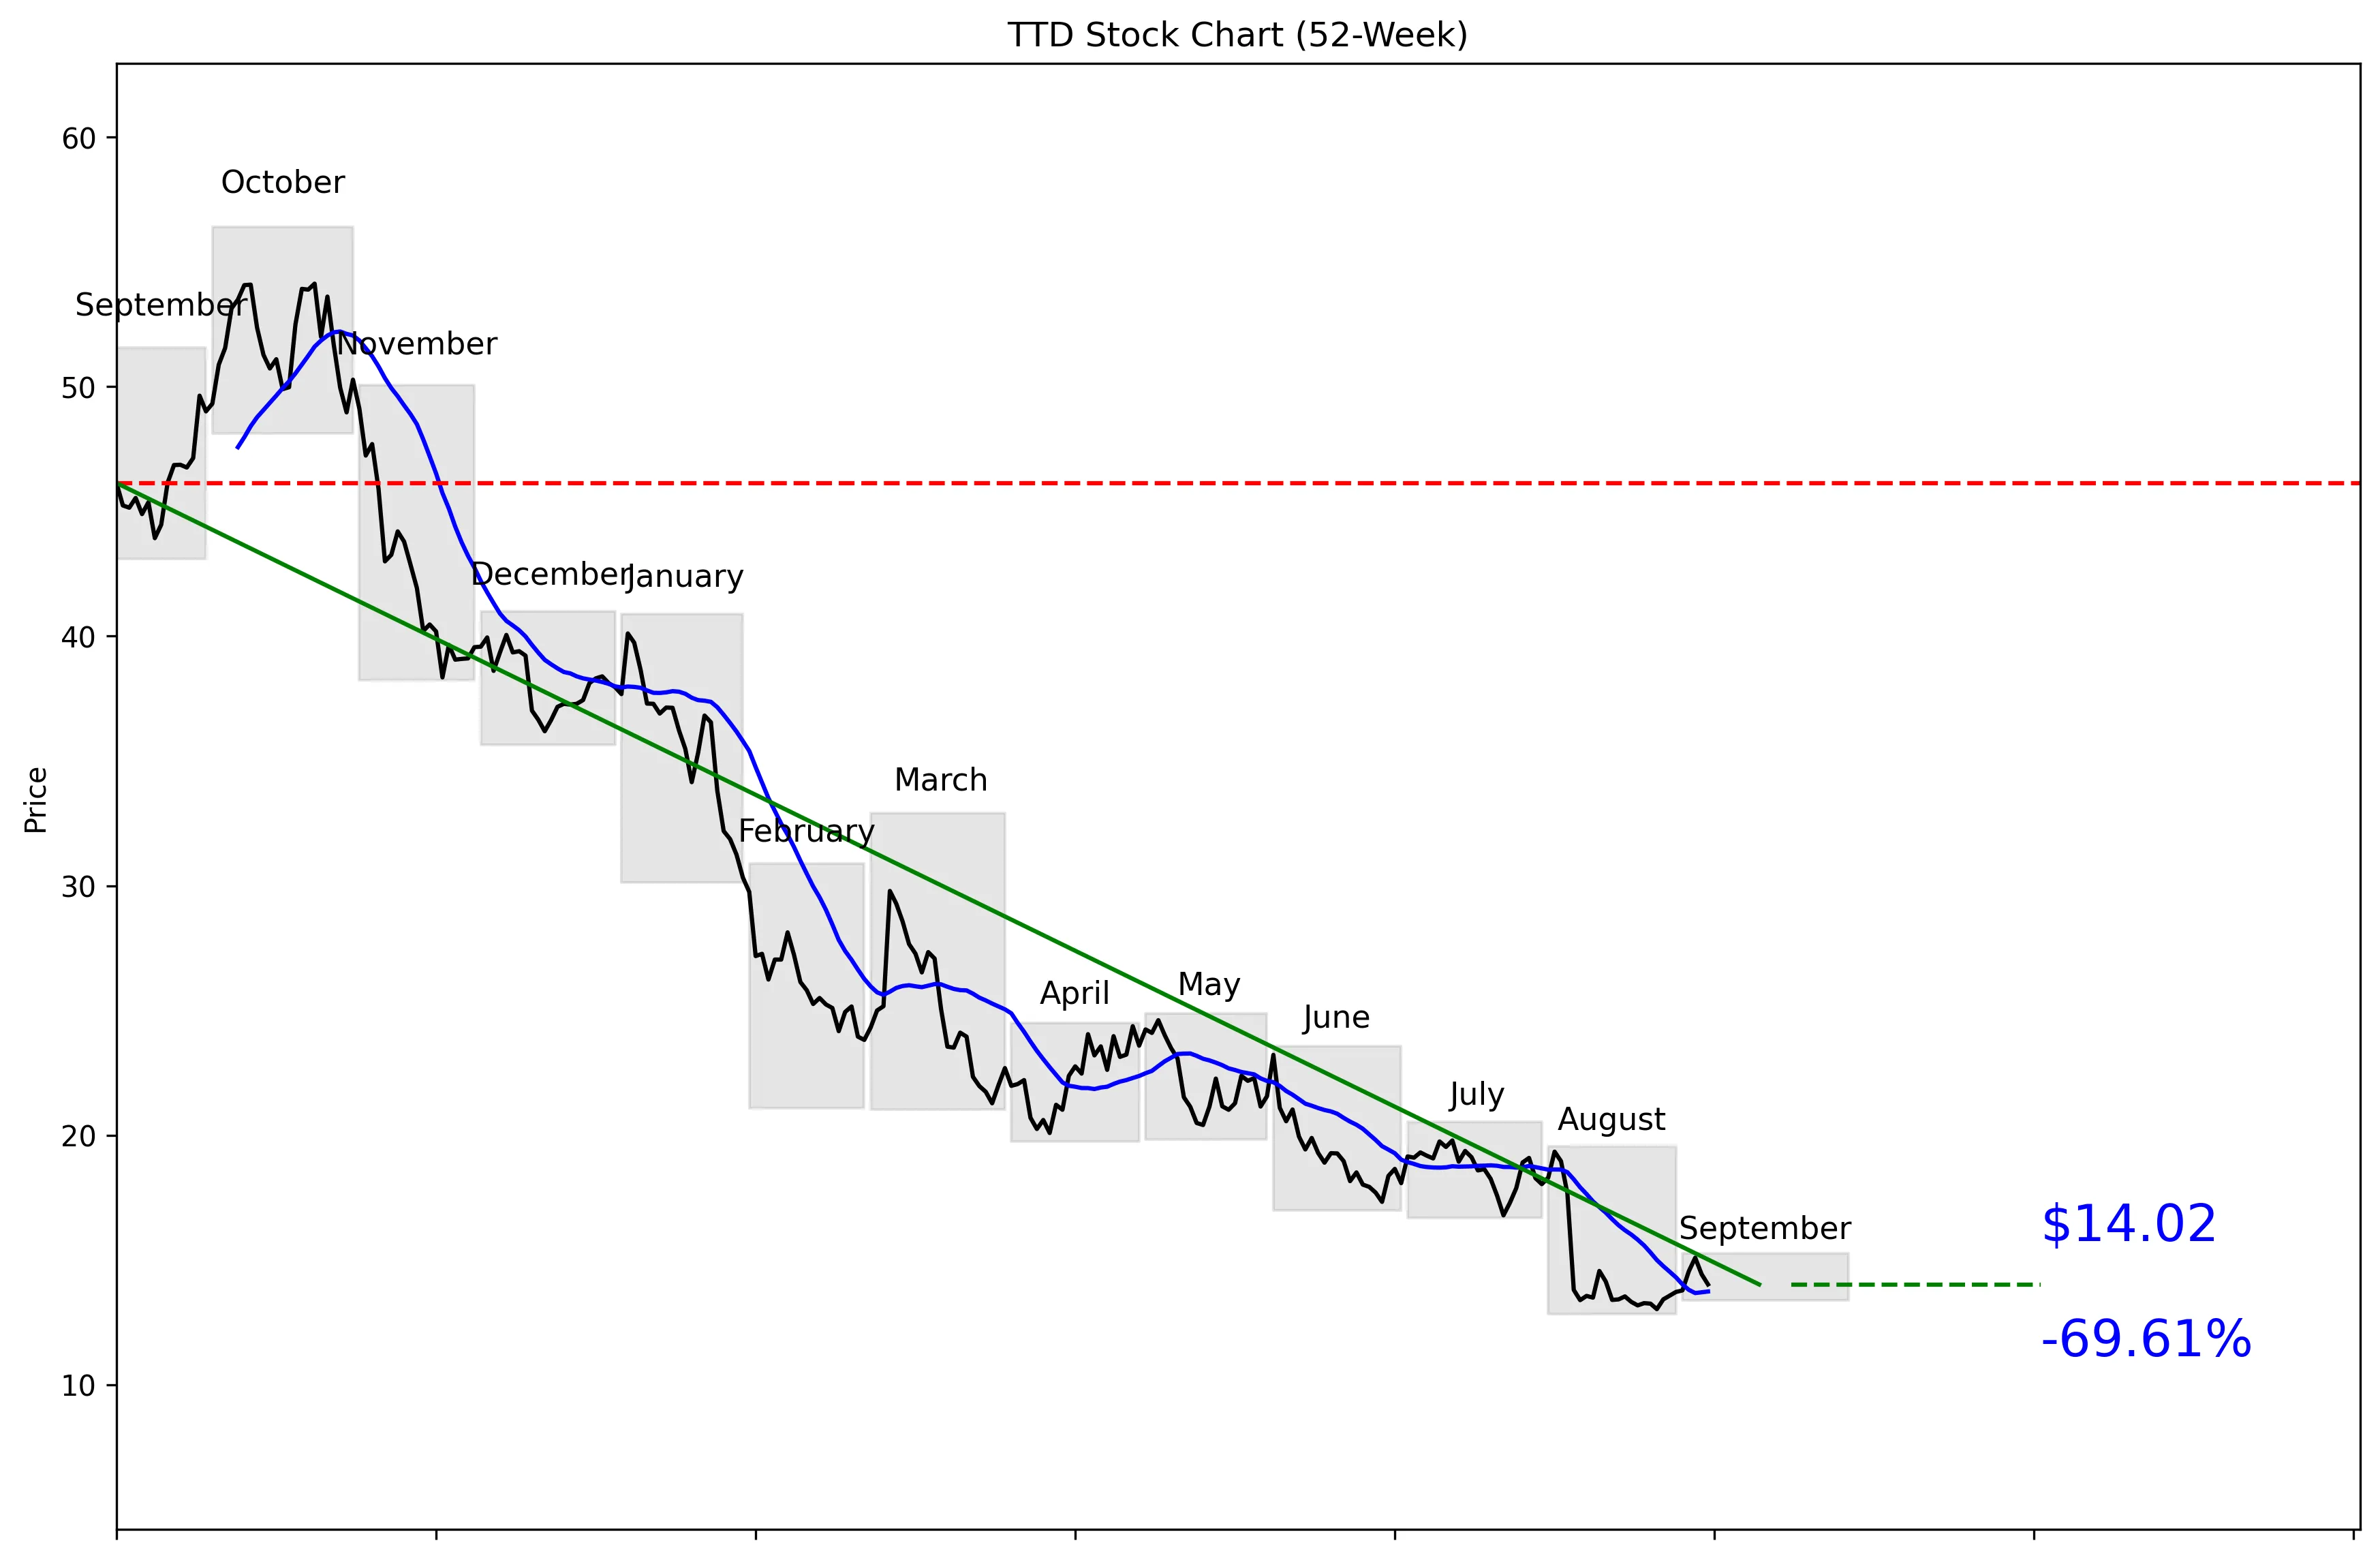
TTD 52-Week Stock Chart
Technical Analysis
TTD trades at $13.96, just 3% of the way from its 52-week low of $12.83 to its $56.39 high. The stock is 75.14% below that high and only 9.28% above the low, confirming a deeply damaged 52-week trend. Near-term momentum has improved, with gains of 2.19% over five trading days and 4.71% over 20 trading days. The price is 2.06% above its 20-day moving average of $13.74. Support sits at $13.03, while resistance at $19.34 remains a major hurdle.


Recent News and Developments

Trade Desk cuts workforce by 15%

The Trade Desk approved an organizational realignment that will reduce its workforce by approximately 15%. The company expects $39 million to $51 million in cash restructuring charges, partly offset by a $4 million to $5 million stock-based compensation reversal. Source: U.S. Securities and Exchange Commission

Trade Desk removed from the S&P 500

S&P Dow Jones Indices will remove The Trade Desk from the S&P 500 before trading opens on September 21, 2026. TTD will move into the S&P SmallCap 600, a sharp reversal after joining the S&P 500 in July 2025. Source: S&P Dow Jones Indices

Evercore lifts TTD target to $14

Evercore ISI raised its TTD price target from $13 to $14 while keeping an In Line rating. The firm increased its fiscal 2026 adjusted EBITDA forecast by 3% and its 2027 forecast by 14% after the workforce reduction, but the unchanged rating signals little conviction. Source: Investing.com


Market Sentiment and Analyst Recommendations

Bull Case
The bull case starts with the balance sheet: $1.49 billion in cash against $434.11 million in total debt. Revenue is $2.99 billion, revenue growth is positive at 3.0%, and the stock trades at 16.62 times earnings. The shares are only 9.28% above their 52-week low, so much of the market’s pessimism is already reflected in the price. Management’s 15% workforce reduction could improve operating efficiency, although it will require $39 million to $51 million in cash restructuring charges. Evercore ISI increased its fiscal 2026 adjusted EBITDA forecast by 3% and its 2027 forecast by 14% following the restructuring. The reason to buy here is straightforward: a cash-rich company near its yearly low has a credible cost-cutting catalyst and improving short-term momentum.
Bear Case
The stock is down 75.14% from its 52-week high, which signals more than routine volatility. Revenue growth of 3.0% is weak for a company still valued at 16.62 times earnings. The consensus target is $13.53, below the current $13.96 price, and the 30-analyst recommendation is hold. The 15% workforce reduction creates execution risk and carries $39 million to $51 million in cash restructuring charges. TTD will leave the S&P 500 before trading opens on September 21, 2026, and move into the S&P SmallCap 600 after joining the larger index in July 2025. Evercore’s $14 target is barely above the current price, and its unchanged In Line rating reinforces the lack of near-term upside conviction.
What to Watch
The first event to track is TTD’s removal from the S&P 500 before trading opens on September 21, 2026. Investors should then watch how quickly the 15% workforce reduction translates into improved results after $39 million to $51 million in cash restructuring charges. Revenue growth must improve from 3.0% for the bullish thesis to gain credibility. Price action around the $13.03 support level is critical because the 52-week low is close behind at $12.83. A sustained move above the $19.34 near-term resistance level would materially improve the technical setup. Conversely, a break below $13.03 would put the yearly low back in play and strengthen the bear case.
Analyst Consensus
HOLD

Based on 30 analyst opinions
Low Target
$9.00
Mean Target
$13.53
High Target
$21.00


Earnings and Financial Data

Sector
Communication Services
Industry
Advertising Agencies
Employees
3,843
Earnings & Dividends
Next Earnings
Nov 05, 2026
EPS (Trailing)
$0.84
Dividend Yield
None
Payout Ratio
0%

Frequently Asked Questions

Is TTD a good stock to buy?
TTD has a hold recommendation from 30 analysts, while its $13.96 price is above the $13.53 consensus target. The takeaway is that the available data does not support a clear buy rating.
What is TTD’s price target?
The consensus analyst target is $13.53, with estimates ranging from $9.00 to $21.00. The takeaway is that analyst expectations vary widely and the consensus sits below the current $13.96 price.
Is TTD stock undervalued?
TTD trades at a P/E ratio of 16.62 and has revenue growth of 3.0%. The takeaway is that the valuation is not obviously cheap based on growth alone.
What are TTD’s support and resistance levels?
Near-term support is $13.03, and near-term resistance is $19.34. The takeaway is that the downside level is close to the current $13.96 price, while resistance is substantially higher.
How far is TTD from its 52-week high?
TTD is 75.14% below its $56.39 high and 9.28% above its $12.83 low. The takeaway is that the stock remains near the bottom of its 52-week range.

Related Stock Reports

Disclaimer: This report is for informational purposes only and does not constitute financial advice. The analysis and opinions expressed are those of AltStation.io and should not be relied upon as the sole basis for investment decisions. Always conduct your own research and consult with a qualified financial advisor before making investment decisions. Past performance does not guarantee future results. Updated September 09, 2026.