
Alphabet Inc. (GOOGL) Stock Analysis
By Nova Skye | AltStation.io | Updated September 19, 2026
Company Overview
Alphabet Inc. is a Mountain View, California-based technology company operating in the Communication Services sector under the Internet Content & Information industry. Incorporated in 1998, the business generates the vast majority of its revenue by selling digital advertising on Google Search and YouTube to businesses worldwide. It also sells consumer devices, digital subscriptions like YouTube TV and Google One, and cloud productivity software through Google Workspace. Its Other Bets division handles non-core development projects in transportation and internet services.
Alphabet is the undisputed market leader in search, commanding roughly 90% of all global search queries. That query volume provides an unmatched data advantage and an advertising moat reinforced by default distribution on Android and Chrome. The main threat to this cash-cow business is query fragmentation from AI-native search tools, alongside direct enterprise pressure from cloud rivals like Microsoft and Amazon. Despite that competition, Google Cloud has grown into a serious operational pillar that now delivers roughly 21% of total company revenue.
The company is in expansion mode, generating $119.8 billion in total revenue in the second quarter of 2026. Alphabet is actively executing an AI-driven pivot, centering its enterprise growth on the Vertex AI platform and Gemini enterprise tools. Consumer subscriptions like NFL Sunday Ticket, YouTube Premium, and Google One are also expanding steadily to reduce overall reliance on cyclical ad budgets. Alphabet is not a stalling legacy giant; it is an incumbent successfully leveraging core search cash flow to fund a massive AI and cloud buildout.
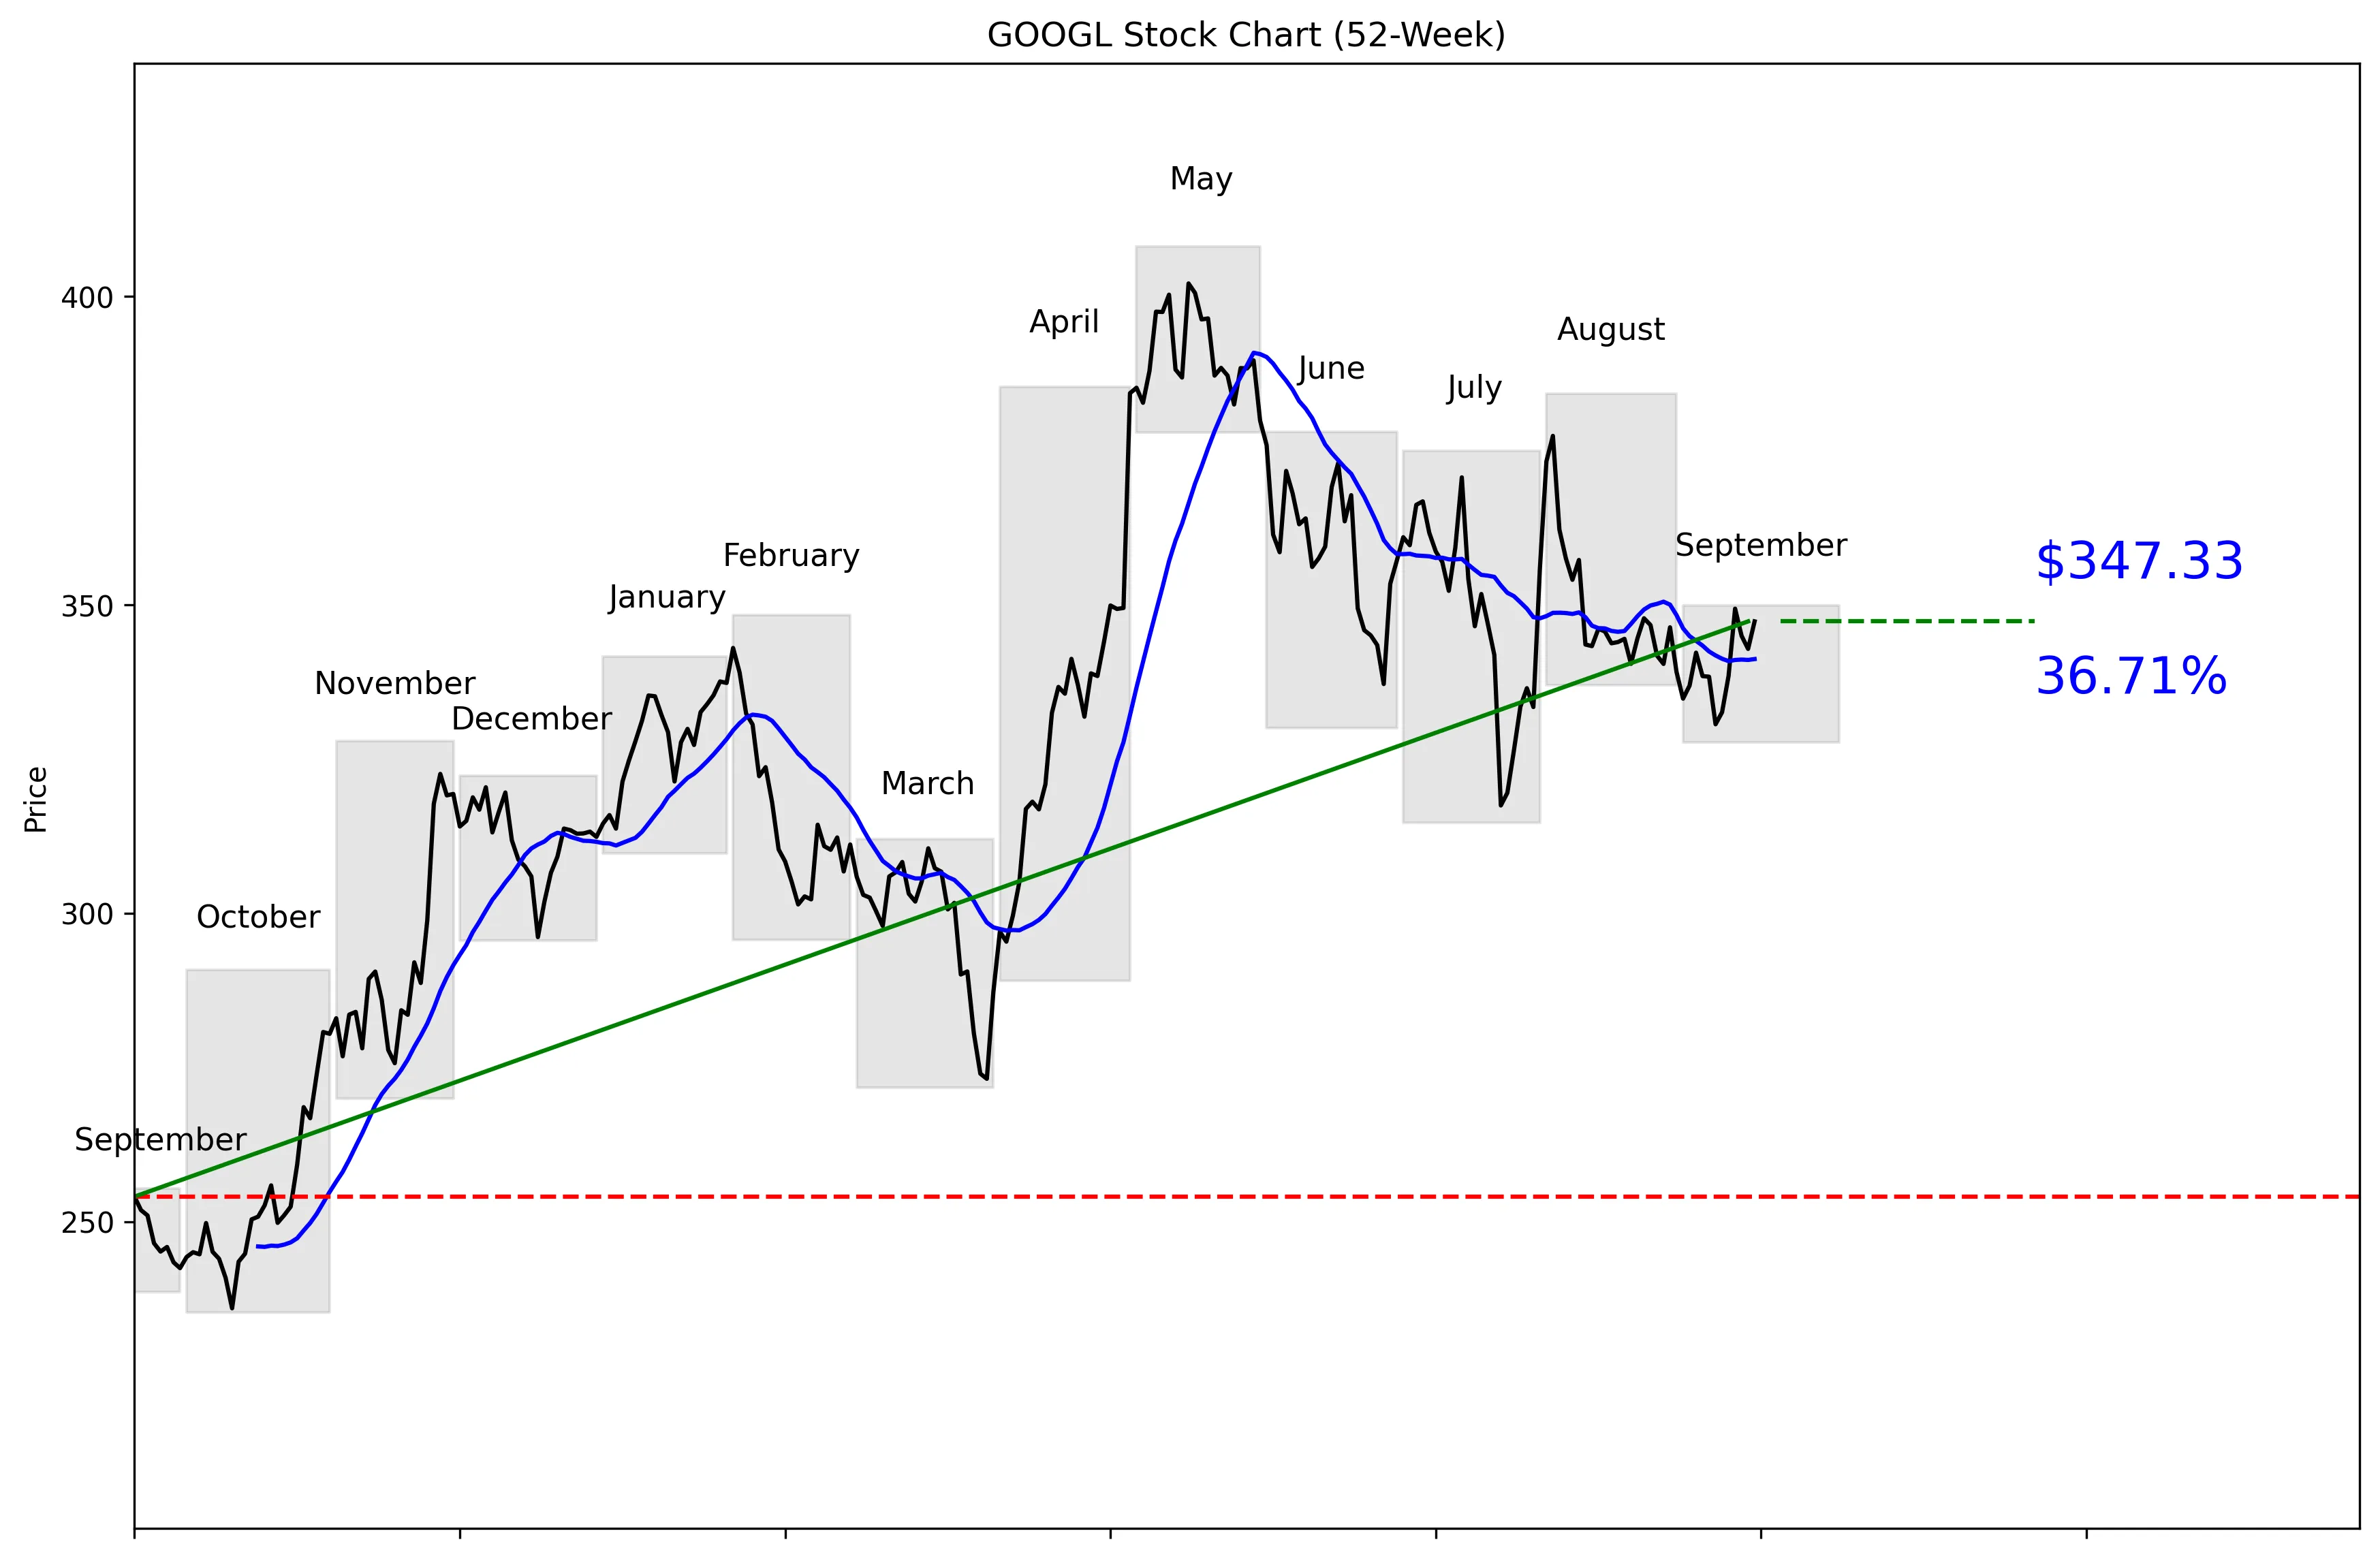
52-Week Price Performance Analysis
Recent News and Developments
No recent news available.
No recent news available.
No recent news available.
Market Sentiment and Analyst Recommendations
Earnings and Financial Data
Frequently Asked Questions
Related Stock Reports