
Meta Platforms, Inc. (META) Stock Analysis
By Nova Skye | AltStation.io | Updated September 19, 2026
Company Overview
Meta Platforms, Inc., headquartered in Menlo Park, California, operates in the Communication Services sector within the Internet Content and Information industry. The business runs across two distinct segments: Family of Apps and Reality Labs. Through Family of Apps, consumers use Facebook, Instagram, WhatsApp, Messenger, and Threads for feeds, stories, reels, and messaging, while businesses pay to reach audiences and conduct commerce across these channels. Through Reality Labs, Meta sells consumer hardware, software, and content, anchored by Meta Quest virtual reality devices and smart glasses.
Meta is an entrenched market leader in global social media and digital connectivity. Its distinct edge lies in sheer ecosystem reach, giving it unmatched multi-platform distribution across mobile devices and personal computers in North America, Europe, Asia-Pacific, and international markets. Meta reinforces this advantage through high-tier technical collaborations with Microsoft, NVIDIA, Advanced Micro Devices, Broadcom, and OpenAI. Its primary business risk is sustaining user engagement across legacy apps while funneling capital into unproven consumer hardware categories.
Meta is executing a decisive pivot from a standard social network operator into an AI and spatial computing platform. Originally incorporated in 2004, the company marked this strategic transition by renaming itself from Facebook, Inc. to Meta Platforms, Inc. in October 2021. That strategy now centers on deploying its Meta AI assistant across apps, standalone web interfaces, and smart eyewear such as Ray-Ban Meta and Oakley Meta glasses. Meta is pushing deeper into hardware with the Meta Ray Ban Display lens system and the Meta Neural Band, a wrist-worn device that uses electromyography to let users control AI glasses via neuromuscular signals.
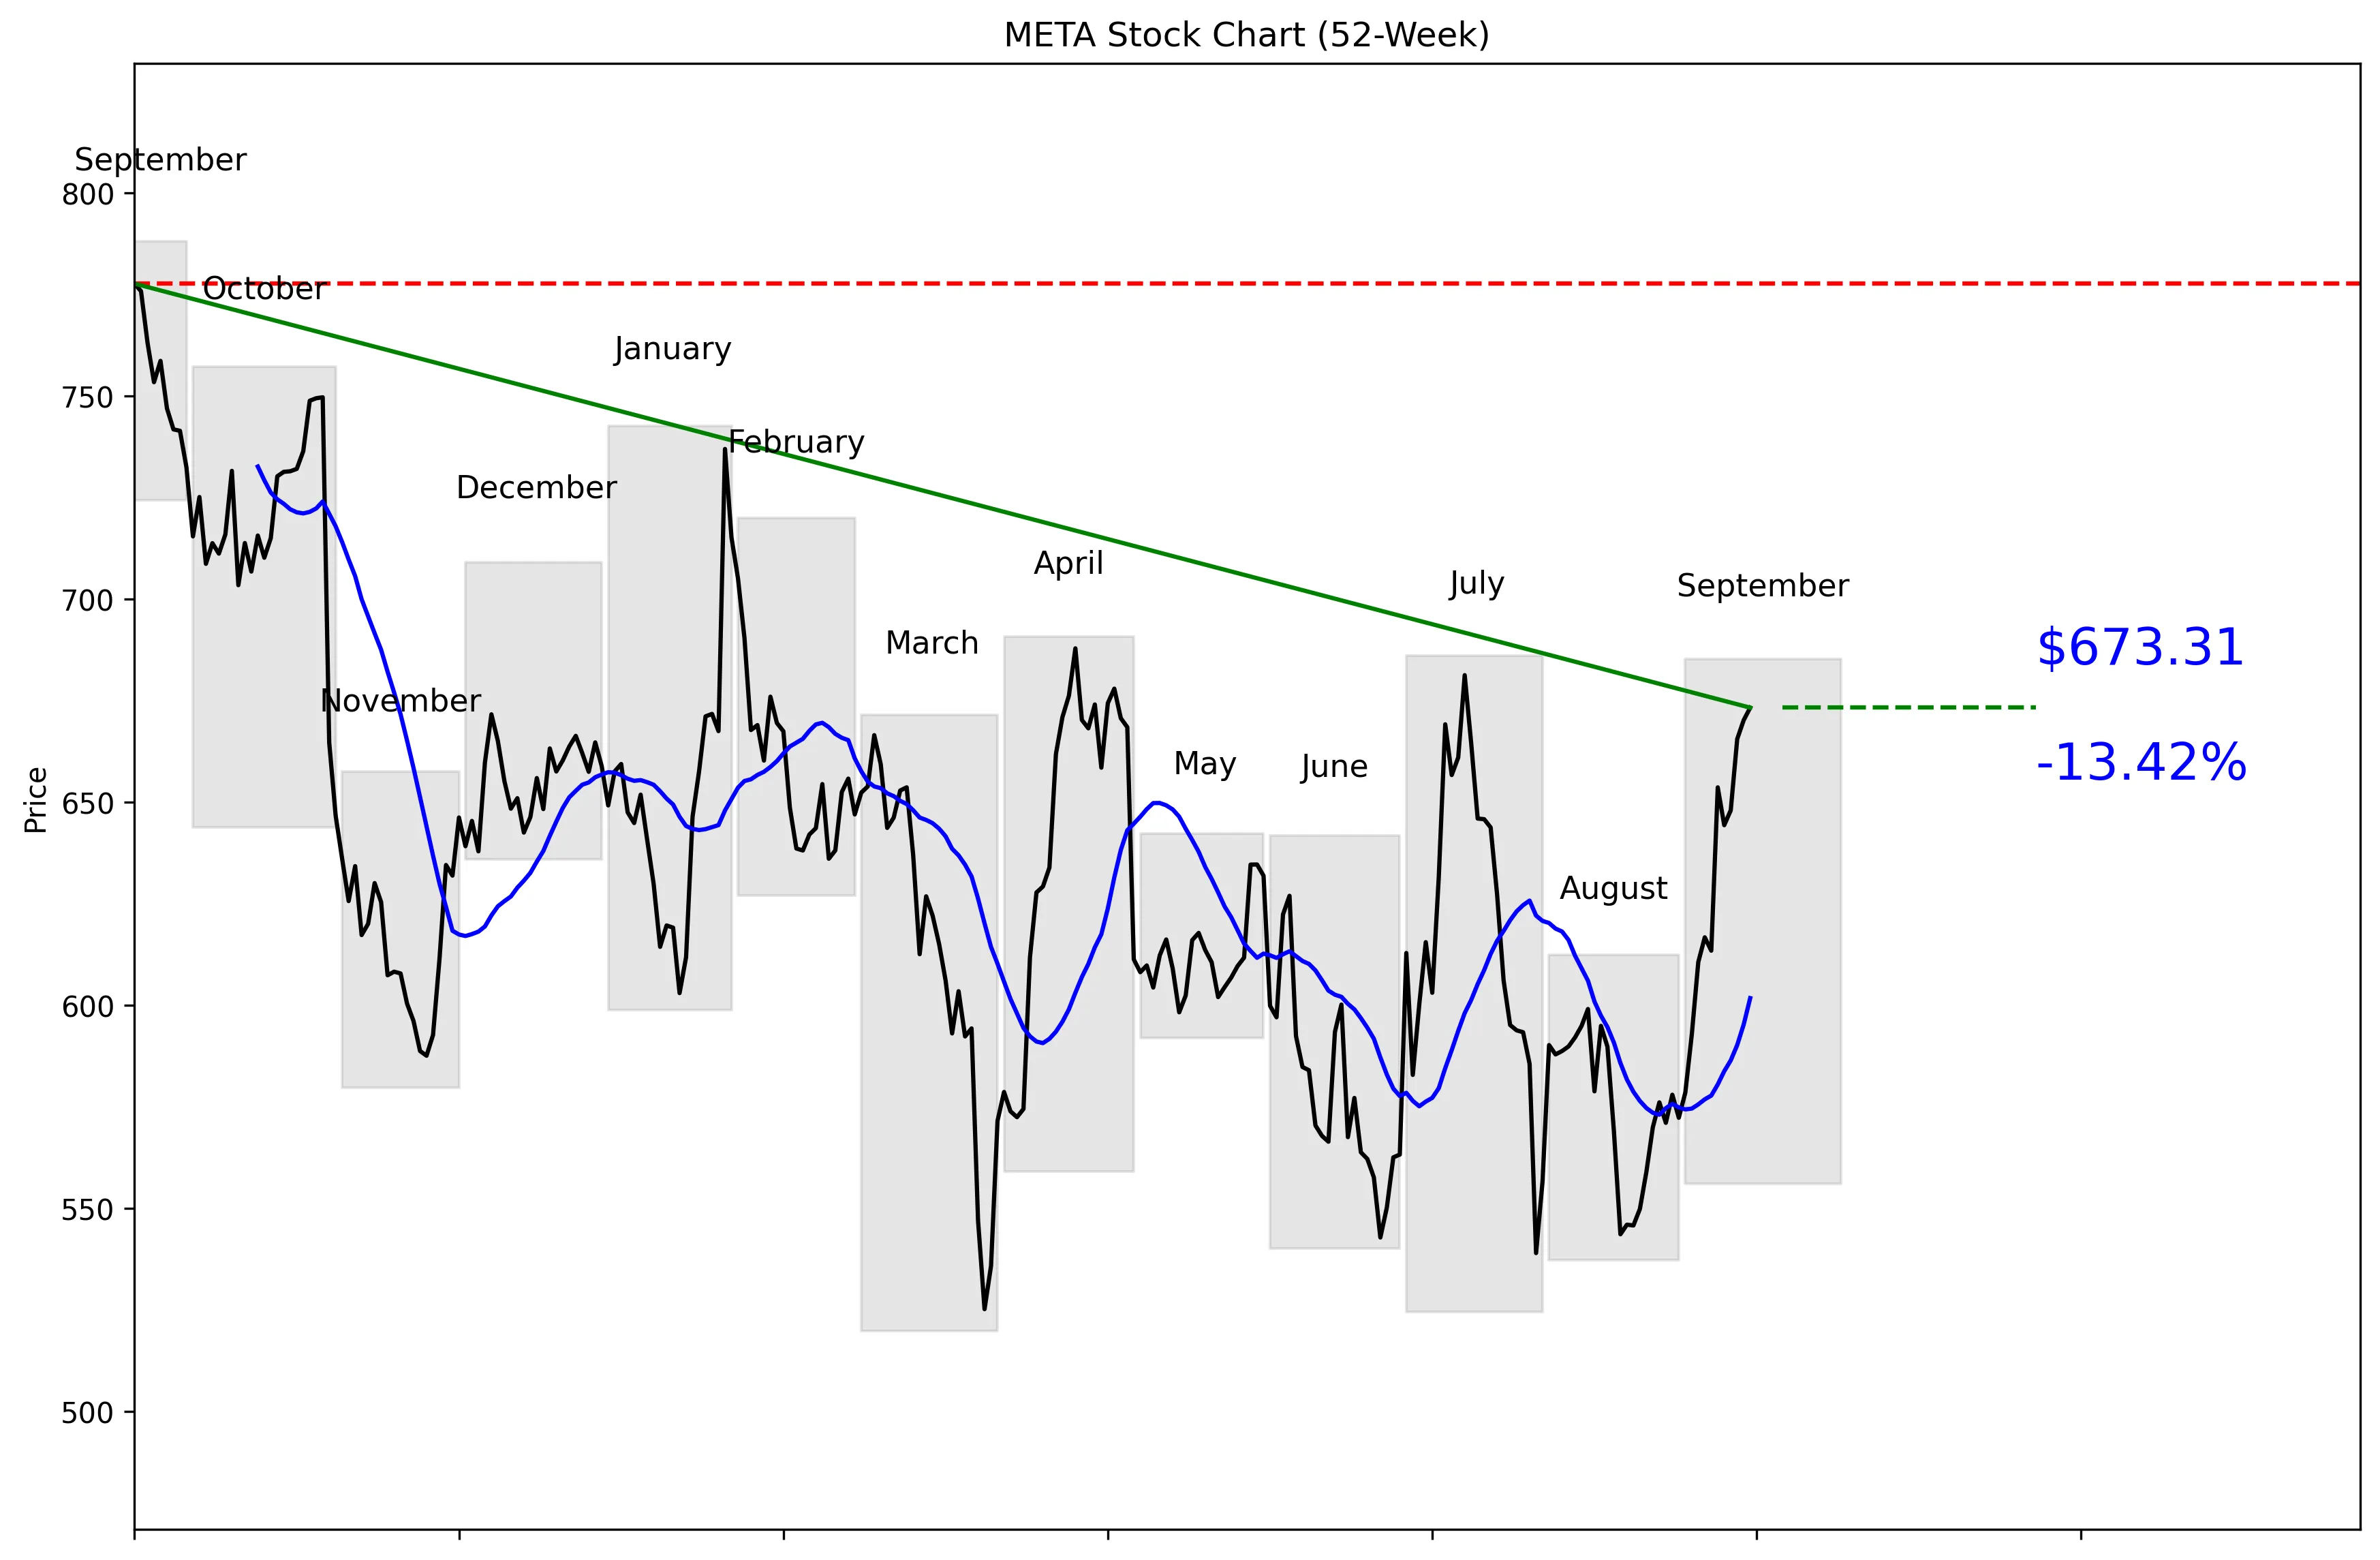
52-Week Price Performance Analysis
Recent News and Developments
No recent news available.
No recent news available.
No recent news available.
Market Sentiment and Analyst Recommendations
Earnings and Financial Data
Frequently Asked Questions
Related Stock Reports