ALTSTATION.IO

Willis Towers Watson Public Limited Company (WTW) Stock Analysis

By Nova Skye | AltStation.io | Updated October 15, 2026

Price
$310.29
Change
+4.44%
Market Cap
$28.82B
Avg Volume
533.2K

Company Overview

Willis Towers Watson Public Limited Company (WTW) is a London-based financial services firm in the insurance brokerage industry, operating through two primary segments: Health, Wealth & Career, and Risk & Broking. Founded in 1828 and formerly known as Willis Group Holdings before its January 2016 name change, the company sells risk advice, commercial insurance broking, pension administration, and benefits consulting to corporate clients worldwide. Enterprises rely on WTW to structure coverage for high-stakes exposures like aerospace, marine, and construction, while licensing its proprietary software for actuarial modeling and capital management. It operates as an outsourced risk strategist and benefits manager for global businesses.

WTW sits firmly as an established global player, but it operates as a challenger chasing industry heavyweights Marsh McLennan and Aon. While competitors lean heavily on massive acquisition sprees, WTW leans on its deep actuarial roots, proprietary risk modeling, and integrated human capital data to win clients. The main threat is execution speed; WTW posted 5% organic revenue growth in 2024, trailing Aon at 6% and Marsh McLennan at 7%. It also faces pressure from aggressive mid-tier consolidators like Arthur J. Gallagher, meaning WTW cannot afford any slip in client retention.

The company is growing steadily, generating $9.93 billion in revenue in 2024, up 5% from $9.48 billion in 2023. Leadership is streamlining operations through multi-year transformation programs and pruning non-core assets, such as the sale of its TRANZACT business. That operational tightening gives WTW cleaner leverage, but the firm still needs to accelerate organic revenue to narrow the performance gap with its larger peers. The restructuring sets a solid baseline, yet sustained upside depends entirely on whether management converts these margin gains into faster top-line growth.

Key Financials
Market Cap
$28.82B
Revenue
$10.10B
EBITDA
$2.82B
Gross Margin
42.5%
Profit Margin
15.5%
Revenue Growth
9.1%
Total Cash
$1.66B
Total Debt
$7.10B
Free Cash Flow
$1.42B


52-Week Price Performance Analysis

Price Statistics
P/E Ratio
19.20
Forward P/E
13.53
Beta
0.47
52-Week High
$351.51
52-Week Low
$240.61
EPS
$16.16
50-Day Avg
$318.99
200-Day Avg
$297.30
Price/Book
3.75
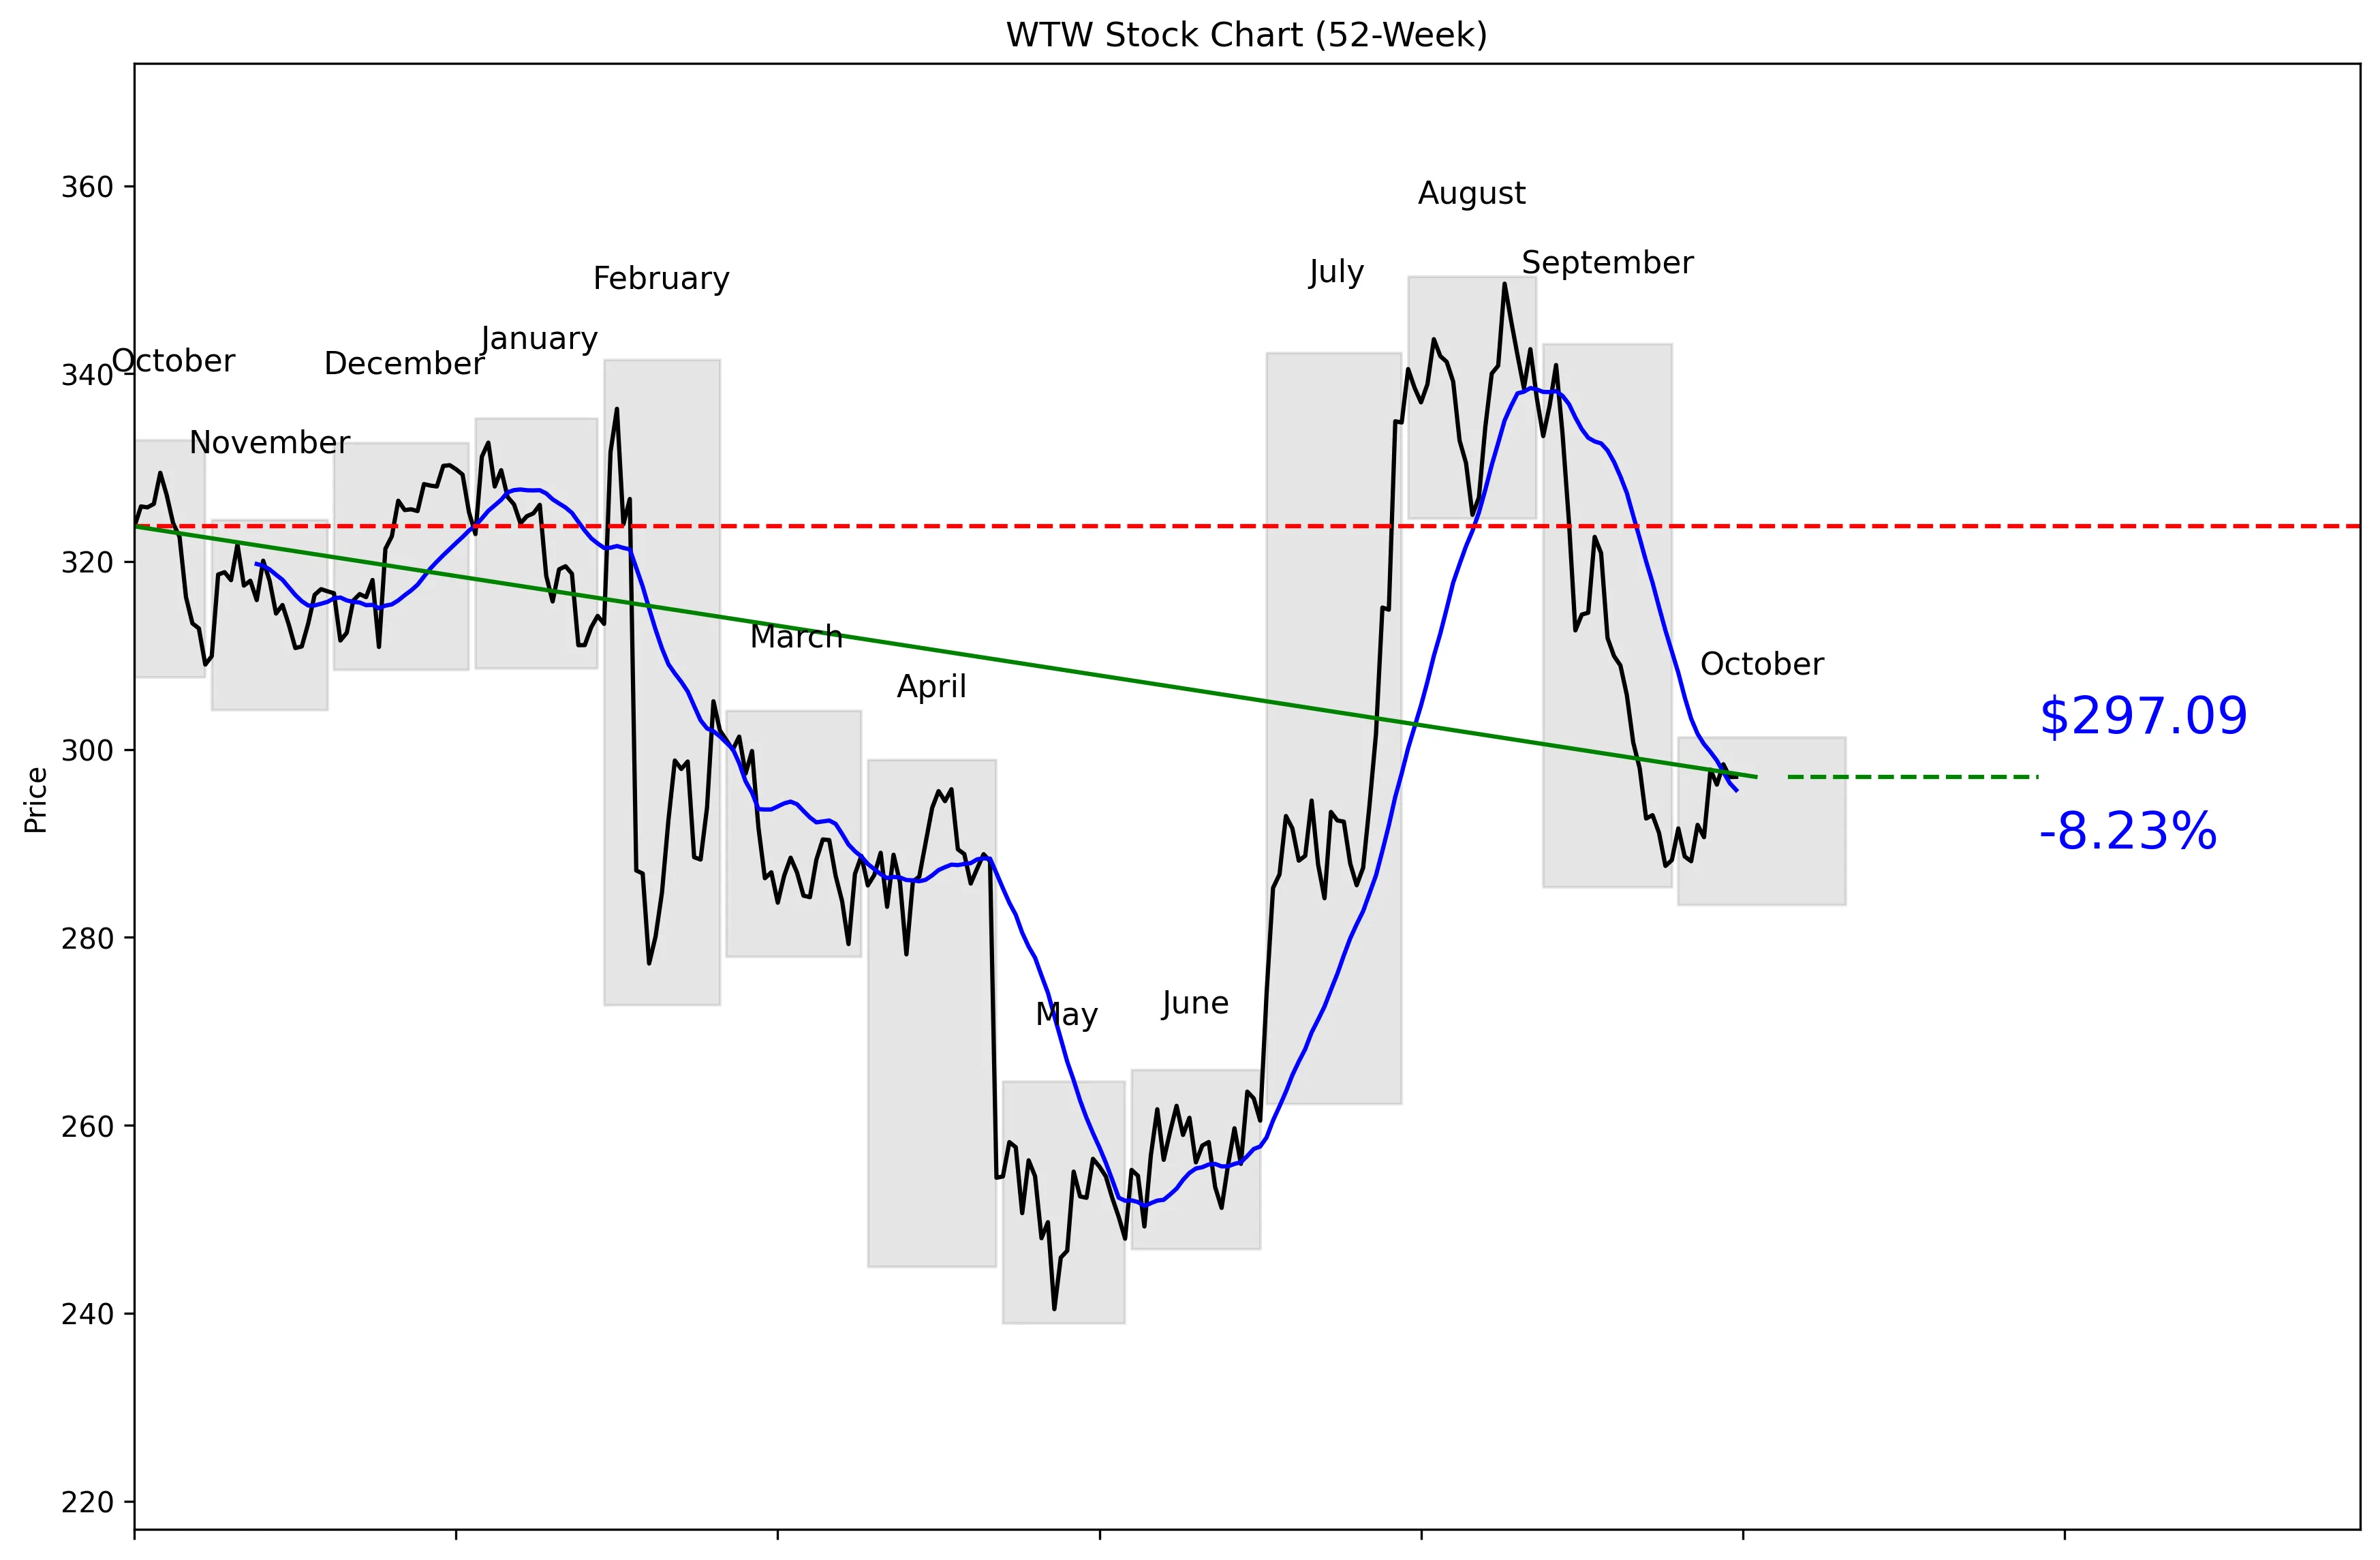
WTW 52-Week Stock Chart
Technical Analysis
WTW trades at $310.29, 52% of the way from its $238.94 52-week low to its $350.34 high. The stock is 15.20% below that high and 24.34% above the low. Five-day momentum is positive at 2.21%, but 20-day momentum remains negative at 4.74%. The technical data places the stock 0.47% versus its $295.69 20-day moving average. Near-term support is $287.61, while resistance sits at $340.92.


Recent News and Developments

WTW adds AI job matching to Rewards AI

WTW launched an AI-powered job-matching feature for its Rewards AI platform on October 13. The tool recommends job disciplines, career bands and levels using WTW’s proprietary job content and survey methodology, while leaving the final decision to compensation teams. Source: GlobeNewswire

Wells Fargo trims WTW target to $364

Wells Fargo cut its WTW price target from $378 to $364 on October 12, a 3.70% reduction, while maintaining its Overweight rating. That is a valuation reset, not a downgrade. Source: GuruFocus

WTW sets October 29 earnings date

WTW will report third-quarter results before the market opens on October 29. Management will hold its earnings call at 9:00 a.m. Eastern Time that day. Source: WTW Investor Relations


Market Sentiment and Analyst Recommendations

Bull Case
Revenue is $10.10 billion and growing at 9.1%, which gives WTW a solid combination of scale and growth. The analyst consensus is buy across 19 analysts, with a $370.63 average target. The target range reaches as high as $455.00, showing that some analysts see substantially more value than the current $310.29 price. WTW’s new Rewards AI job-matching feature adds proprietary job content and survey methodology to its compensation platform. That product could strengthen the company’s position with compensation teams without removing human control from the decision process. At 19.20 times earnings and 15.20% below its 52-week high, WTW offers a credible recovery setup if growth holds and the October 29 results deliver.
Bear Case
WTW carries $7.10 billion in total debt against $1.66 billion in cash, so the balance sheet is not clean. The 19.20 P/E also leaves limited room for weak execution because investors are already paying a meaningful earnings multiple. Twenty-day momentum is negative at 4.74%, showing that the recent five-day rebound has not repaired the broader short-term trend. Wells Fargo reduced its target from $378 to $364, a 3.70% cut, even while keeping its Overweight rating. The stock also gave back its October 8 advance, closing at $297.09 on October 14 after reaching $297.86 on October 8 and trading as high as $300.55 on October 14. A break below $287.61 would weaken the chart further, while failure to clear $340.92 would keep the stock trapped below resistance.
What to Watch
Third-quarter results arrive before the market opens on October 29, followed by a 9:00 a.m. Eastern Time earnings call. The first test is whether WTW can sustain its reported 9.1% revenue growth. Investors should also watch whether management provides evidence that Rewards AI and its new job-matching feature are gaining traction. On the chart, $295.69 is the 20-day moving average and $287.61 is the key near-term support level. A move above $340.92 would break near-term resistance and put the $350.34 52-week high back in focus. A drop below $287.61, weaker revenue growth, or additional analyst target cuts would damage the bull case.
Analyst Consensus
BUY

Based on 19 analyst opinions
Low Target
$310.00
Mean Target
$370.63
High Target
$455.00


Earnings and Financial Data

Sector
Financial Services
Industry
Insurance Brokers
Employees
48,100
Earnings & Dividends
Next Earnings
Oct 29, 2026
EPS (Trailing)
$16.16
Dividend Yield
129.0%
Payout Ratio
23.3%

Frequently Asked Questions

Is WTW a good stock to buy?
WTW has a buy recommendation from 19 analysts, 9.1% revenue growth and an average analyst target of $370.63 versus a $310.29 share price. The clear takeaway is that analysts are bullish, but the $7.10 billion debt load remains a material risk.
What is WTW’s price target?
The average analyst target is $370.63, with estimates ranging from $310.00 to $455.00. The clear takeaway is that the consensus target sits above the current $310.29 price, although the low estimate does not.
Is WTW stock overvalued?
WTW trades at 19.20 times earnings and has a market capitalization of $28.82 billion. The clear takeaway is that the stock is not priced like a distressed company, so continued 9.1% revenue growth matters.
What are WTW’s support and resistance levels?
Near-term support is $287.61, based on the 30-day low, and resistance is $340.92, based on the 30-day high. The clear takeaway is that those are the key levels defining the current trading range.
Does WTW pay a dividend?
The provided data does not include a dividend amount or dividend yield. The clear takeaway is that no dividend conclusion can be made from the available figures.

Related Stock Reports

Disclaimer: This report is for informational purposes only and does not constitute financial advice. The analysis and opinions expressed are those of AltStation.io and should not be relied upon as the sole basis for investment decisions. Always conduct your own research and consult with a qualified financial advisor before making investment decisions. Past performance does not guarantee future results. Updated October 15, 2026.