ALTSTATION.IO

Arthur J. Gallagher & Co. (AJG) Stock Analysis

By Nova Skye | AltStation.io | Updated October 19, 2026

Price
$252.02
Change
+0.77%
Market Cap
$64.60B
Avg Volume
1.4M

Company Overview

Arthur J. Gallagher & Co. is an insurance brokerage and risk management firm headquartered in Rolling Meadows, Illinois. Operating in the financial services sector as an insurance broker, the company acts as a middleman connecting commercial, public, and nonprofit clients with specialized coverage. Through its Brokerage segment, it places retail and wholesale policies, negotiates reinsurance, and manages employee benefit programs. Its Risk Management segment handles third-party claims settlement, loss control consulting, and property appraisals. The core business earns steady fees and commissions without taking on direct balance-sheet underwriting risk.

Gallagher sits as an entrenched market leader with a 62 billion dollar market cap, ranking among the top four insurance brokers globally. It competes head-to-head against heavyweights Marsh McLennan, Aon, and Willis Towers Watson for major corporate accounts. Gallagher’s key advantage is its scale in specialized wholesale brokerage paired with its proprietary third-party claims administration network. The primary threat comes from rivals like Brown & Brown and private equity consolidators bidding up the price of acquisition targets.

The company is in an aggressive expansion phase, delivering 2025 revenue of approximately 13.9 billion dollars, up roughly 20 percent year-over-year. That top-line surge was backed by 6 percent full-year organic revenue growth, proving the underlying engine is expanding without relying solely on dealmaking. Gallagher continues to execute its signature roll-up strategy, integrating dozens of tuck-in acquisitions each year into its global distribution pipeline. With trailing twelve-month revenue approaching 15 billion dollars, the business is compounding cash flows at an impressive, highly durable clip.

Key Financials
Market Cap
$64.60B
Revenue
$15.11B
EBITDA
$4.29B
Gross Margin
43.2%
Profit Margin
10.4%
Revenue Growth
30.9%
Total Cash
$1.39B
Total Debt
$14.11B
Free Cash Flow
$2.08B


52-Week Price Performance Analysis

Price Statistics
P/E Ratio
41.79
Forward P/E
17.02
Beta
0.55
52-Week High
$284.33
52-Week Low
$190.75
EPS
$6.03
50-Day Avg
$246.06
200-Day Avg
$231.93
Price/Book
2.72
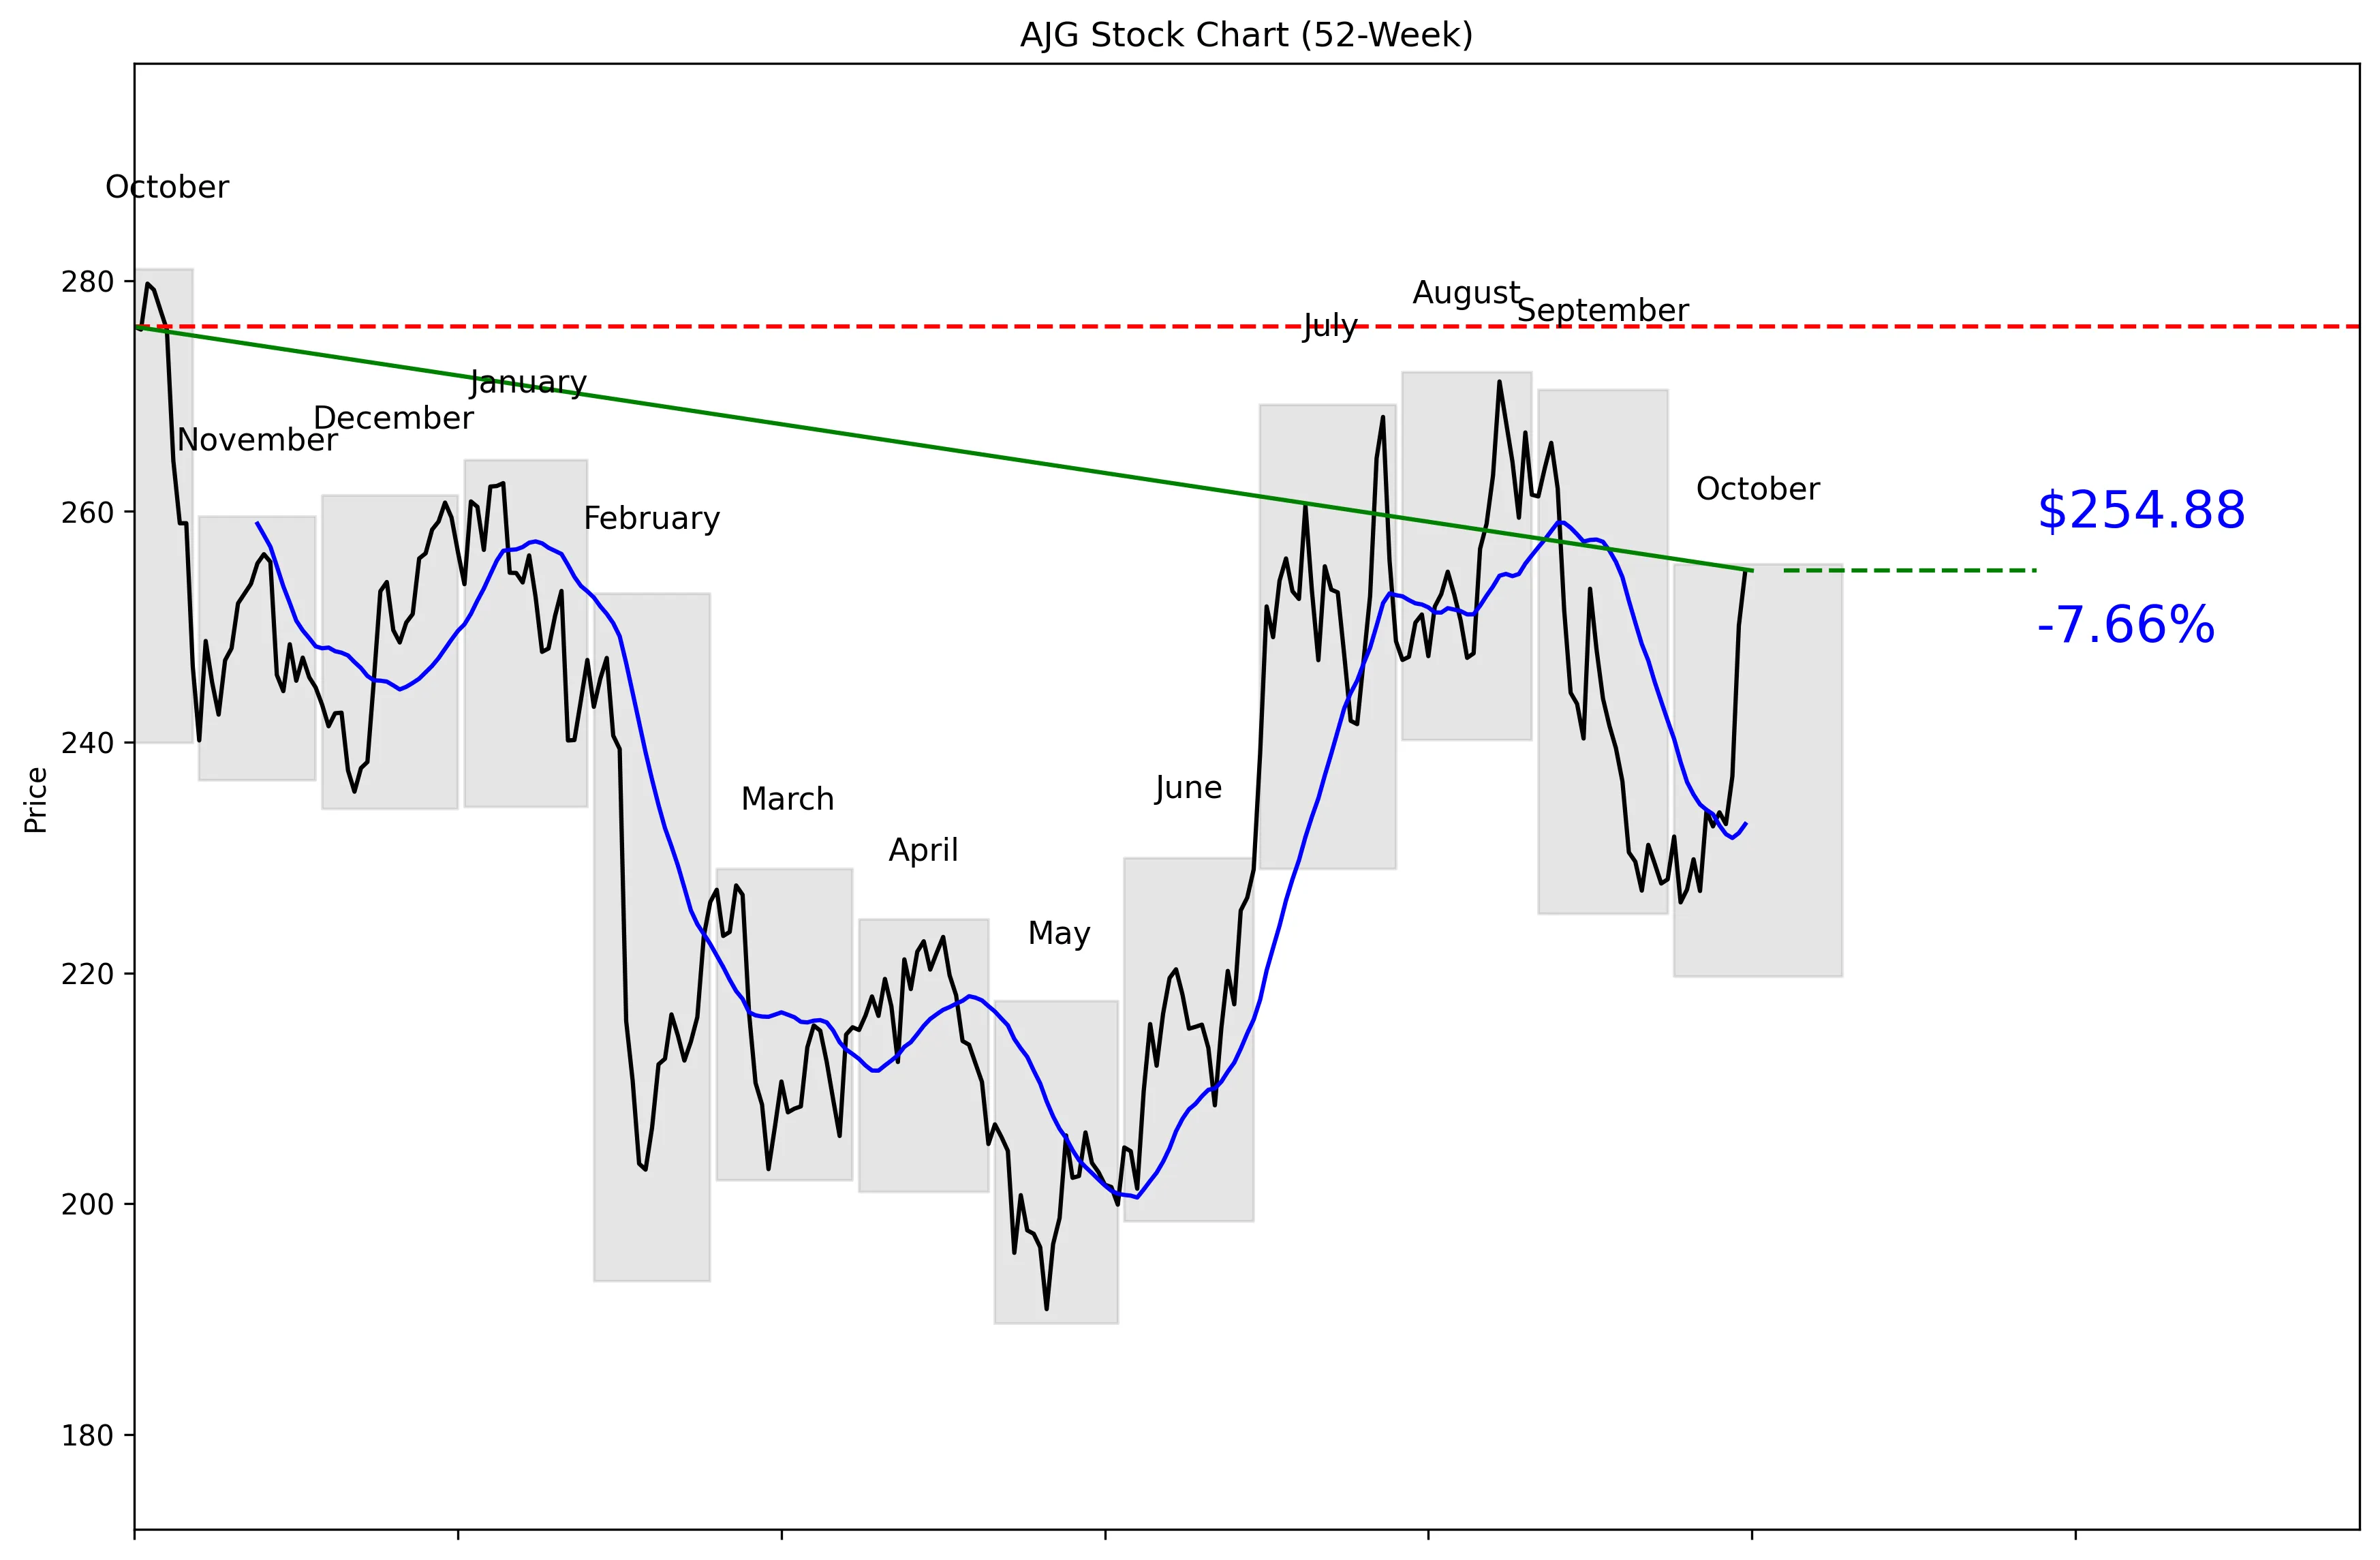
AJG 52-Week Stock Chart
Technical Analysis
AJG trades at $252.02, placing it 71% of the way from its $189.61 52-week low to its $281.02 high. The stock is 9.30% below that high and 34.42% above the low. Price sits 9.44% above the 20-day moving average of $232.90, confirming strong short-term momentum. AJG gained 9.53% over the last five trading days and 6.43% over the last 20. Near-term support is $226.11, while resistance sits at $261.99.


Recent News and Developments

AJG jumps 9.53% for the week

AJG climbed from $232.70 on October 9 to $254.88 on October 16. Shares gained 5.51% on October 15 and another 1.91% on October 16, with October 15 volume reaching 2.19 million shares. Source: ChartExchange

Wells Fargo trims AJG target to $284

Wells Fargo cut its AJG price target from $291 to $284 on October 12, a 2.4% reduction, while maintaining an Overweight rating. That is a cautious adjustment, not a downgrade. Source: TipRanks

Gallagher publishes financial-benefits research

Gallagher’s October 14 report surveyed 3,717 US organizations and found that 85% offer retirement benefits, but only 28% of employees believe their savings strategy will achieve their goals. The gap supports demand for Gallagher’s benefits consulting and financial-guidance services. Source: Arthur J. Gallagher & Co.


Market Sentiment and Analyst Recommendations

Bull Case
Revenue grew 30.9% to $15.11 billion, giving AJG a strong fundamental growth case. Analysts expect third-quarter diluted earnings of $3.01 per share, up 29.7% from $2.32 a year earlier. Gallagher’s benefits business also has room to expand: 85% of surveyed US organizations offer retirement benefits, but only 28% of employees believe their savings strategy will achieve their goals. That gap supports demand for benefits consulting and financial-guidance services. The average analyst target of $283.33 is above the current $252.02 price, and 18 analysts rate the stock a buy. AJG is worth buying for investors who believe its 30.9% revenue growth can continue to support a premium valuation.
Bear Case
The biggest problem is valuation: AJG trades at 41.79 times earnings. That multiple leaves little room for a weak quarter or slower growth. Total debt of $14.11 billion also towers over total cash of $1.39 billion, limiting the balance-sheet cushion. Wells Fargo cut its price target from $291 to $284 on October 12, although it kept an Overweight rating. The lowest analyst target is $242.00, below the current price of $252.02. After a 9.53% five-day rally, AJG needs strong results on October 29 to justify both the momentum and the valuation.
What to Watch
The main catalyst is Gallagher’s third-quarter report after the market closes on October 29. Analysts expect diluted earnings of $3.01 per share, representing 29.7% growth from $2.32 a year earlier. Investors should compare that result with the company’s 30.9% revenue growth rate. Price action around $261.99 matters because that is the 30-day high and near-term resistance level. A pullback toward the $232.90 moving average would test whether the recent 9.53% five-day advance has durable support, while $226.11 is the stated 30-day low. The thesis improves if earnings growth remains near 29.7% and price clears $261.99; it weakens if growth disappoints and the stock breaks below $226.11.
Analyst Consensus
BUY

Based on 18 analyst opinions
Low Target
$242.00
Mean Target
$283.33
High Target
$388.00


Earnings and Financial Data

Sector
Financial Services
Industry
Insurance Brokers
Employees
67,456
Earnings & Dividends
Next Earnings
Oct 29, 2026
EPS (Trailing)
$6.03
Dividend Yield
112.0%
Payout Ratio
44.8%

Frequently Asked Questions

Is AJG a good stock to buy?
AJG has a buy recommendation from 18 analysts and revenue growth of 30.9%. The clear takeaway is that analysts favor the stock, but its 41.79 P/E demands continued growth.
What is AJG’s price target?
The average analyst target is $283.33, with estimates ranging from $242.00 to $388.00. The takeaway is that the consensus target sits above the current $252.02 price, although the range is wide.
What is AJG’s 52-week high and low?
The technical price series shows a 52-week high of $281.02 and a low of $189.61. The takeaway is that AJG trades 9.30% below the high and 34.42% above the low.
Is AJG stock overvalued?
AJG trades at a P/E ratio of 41.79 while revenue is growing 30.9%. The takeaway is that the valuation is expensive and depends on strong growth continuing.
What are AJG’s support and resistance levels?
Near-term support is the 30-day low of $226.11, while resistance is the 30-day high of $261.99. The takeaway is that these are the key technical levels around the current $252.02 price.

Related Stock Reports

Disclaimer: This report is for informational purposes only and does not constitute financial advice. The analysis and opinions expressed are those of AltStation.io and should not be relied upon as the sole basis for investment decisions. Always conduct your own research and consult with a qualified financial advisor before making investment decisions. Past performance does not guarantee future results. Updated October 19, 2026.