ALTSTATION.IO

Accenture plc (ACN) Stock Analysis

By Nova Skye | AltStation.io | Updated September 19, 2026

Price
$187.70
Change
-2.81%
Market Cap
$114.86B
Avg Volume
8.4M

Company Overview

Accenture plc is an IT services powerhouse based in Dublin, Ireland, operating within the Technology sector since its founding in 1951. The firm sells high-end strategy, consulting, software engineering, cloud infrastructure, and outsourced business operations spanning finance, HR, and supply chain. They also build and assemble physical automation equipment and commercial robotics for industrial clients. Their buyers are large multinational corporations and public sector organizations across sectors like banking, healthcare, retail, and energy.

Accenture operates as an undisputed market leader across 5 global regions, including the Americas, Europe, the Middle East, Africa, and Asia Pacific. Its clear edge is enterprise stickiness: it manages end-to-end IT lifecycles, from custom application builds to platform risk solutions co-developed with ServiceNow. The structural risk to this model is high operational overhead across its delivery network whenever enterprise clients trim discretionary tech consulting budgets. Even so, competitors struggle to match Accenture’s combined scale in both strategic advisory and large-scale technical implementation.

The company is currently executing an aggressive strategic pivot into enterprise automation and agentic artificial intelligence. Management has locked in key collaborations with OpenAI and Netomi to inject autonomous AI agents directly into corporate workflows and customer support. At the same time, Accenture is scaling specialized infrastructure through a defense and public sector alliance with AWS, a financial data project with SAP Japan, and a smart factory system with Microsoft and Avanade. This push proves Accenture is moving fast to monetize enterprise AI implementation before automated tools eat into legacy consulting revenue.

Key Financials
Market Cap
$114.86B
Revenue
$73.10B
EBITDA
$12.94B
Gross Margin
32.0%
Profit Margin
10.7%
Revenue Growth
5.6%
Total Cash
$10.17B
Total Debt
$8.39B
Free Cash Flow
$12.09B


52-Week Price Performance Analysis

Price Statistics
P/E Ratio
15.00
Forward P/E
12.81
Beta
1.09
52-Week High
$291.09
52-Week Low
$118.15
EPS
$12.51
50-Day Avg
$160.49
200-Day Avg
$203.17
Price/Book
3.60
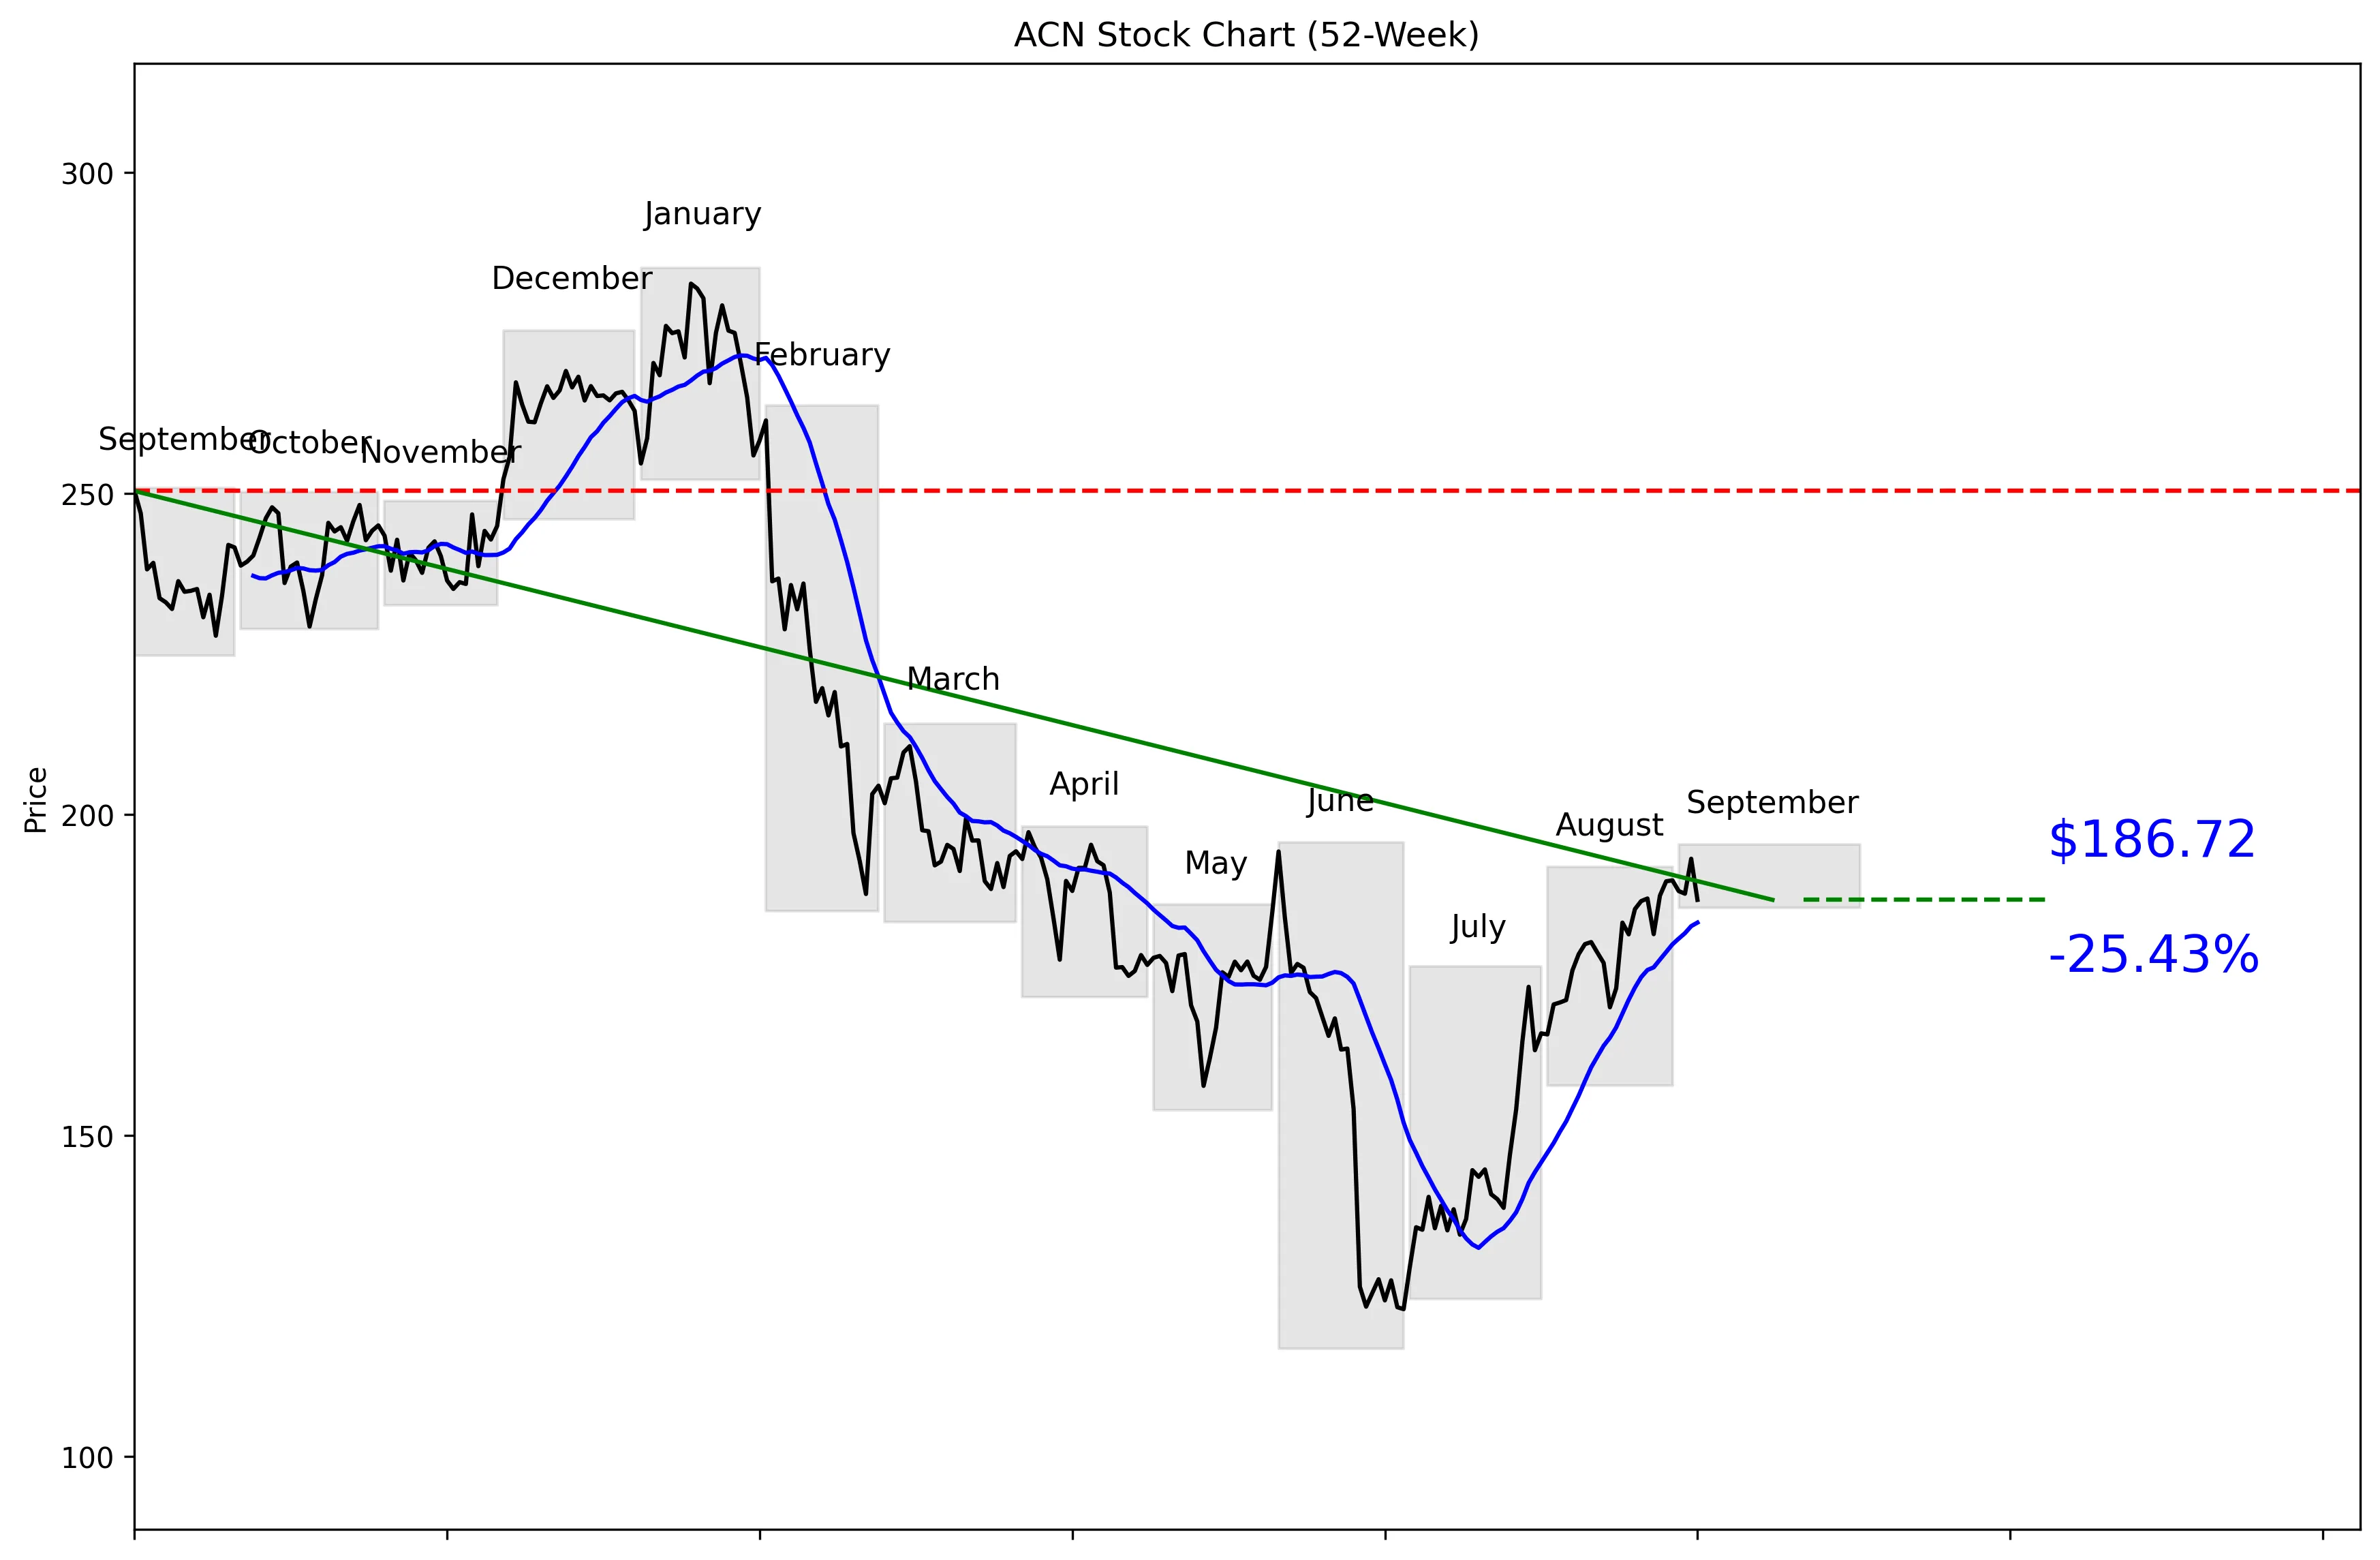
ACN 52-Week Stock Chart
Technical Analysis
ACN trades at $187.70, 42% of the way from its $116.75 52-week low to its $285.21 high. The stock is 34.53% below that high but remains 59.94% above the low. Price sits 1.94% above the 20-day moving average of $183.17. Momentum is mixed: ACN gained 6.26% over the last 20 trading days but fell 1.52% over the last five. Near-term support is $154.06, while $193.12 is the immediate resistance level.


Recent News and Developments

EU clears Accenture’s VTS acquisition

The European Commission cleared Accenture to acquire sole control of Italy-based VTS under its simplified merger-review procedure. Regulators said the banking IT-services deal would not create antitrust concerns because the companies have a small combined market presence. Source: Yahoo Finance

Accenture lands $161.6 million My Health Record contract

Australia’s Digital Health Agency extended Accenture’s infrastructure-services contract for My Health Record from August 2026 through August 2029, with an option running to August 2032. The agreement is valued at about $161.6 million and supports more than 25 million active records. Source: TechBest

ACN jumps 2.9% and beats the major indexes

Accenture rose 2.9% to $193.12 on September 3, outperforming the S&P 500’s 1.06% gain, the Dow’s 1.18% rise and the Nasdaq’s 1.4% advance. The stock had gained 9.93% over the prior month, while Zacks maintained a Rank #3 Hold. Source: Zacks Equity Research


Market Sentiment and Analyst Recommendations

Bull Case
Accenture generated $73.10 billion in revenue, and revenue growth is running at 5.6%. The stock trades at a P/E of 15.00, which is a reasonable valuation if that growth continues. The balance sheet includes $10.17 billion in cash against $8.39 billion in debt. Accenture also secured a contract worth about $161.6 million to support more than 25 million active My Health Record accounts from August 2026 through August 2029, with an option through August 2032. European regulators cleared the VTS acquisition after finding no antitrust concerns, removing a regulatory obstacle from that deal. With ACN 34.53% below its 52-week high and 25 analysts rating it buy, the bull case is that investors are getting a profitable growth company at a less demanding price.
Bear Case
The clearest problem is that the $184.19 analyst target sits below the current price of $187.70. Revenue growth of 5.6% is positive, but it is not strong enough by itself to guarantee a higher valuation. The stock remains 34.53% below its 52-week high, showing how much confidence has already been lost. Five-day momentum is negative at 1.52%, even after a 6.26% gain over the last 20 trading days. The analyst target range of $130.00 to $275.00 shows wide disagreement about what the business is worth. ACN also carries $8.39 billion in debt, so investors need continued execution rather than relying on the $10.17 billion cash position alone.
What to Watch
The first test is whether ACN can break above the 30-day high of $193.12. A move back below the 20-day moving average of $183.17 would weaken the recent 6.26% 20-day advance. The larger downside threshold is $154.06, the current 30-day low and near-term support. Investors should track whether revenue growth holds above, matches, or falls below the reported 5.6% rate. Execution on the $161.6 million My Health Record contract matters because the agreement runs from August 2026 through August 2029 and includes an option through August 2032. Progress on the cleared VTS acquisition and changes to the $184.19 analyst target will show whether the operating story is improving faster than expectations.
Analyst Consensus
BUY

Based on 25 analyst opinions
Low Target
$130.00
Mean Target
$184.19
High Target
$275.00


Earnings and Financial Data

Sector
Technology
Industry
Information Technology Services
Employees
799,000
Earnings & Dividends
Next Earnings
Oct 01, 2026
EPS (Trailing)
$12.51
Dividend Yield
338.0%
Payout Ratio
50.9%

Frequently Asked Questions

Is ACN a good stock to buy?
ACN has a buy recommendation from 25 analysts, revenue growth of 5.6%, and a P/E of 15.00. The takeaway is that the valuation and growth are attractive, but the current price is already above the average analyst target.
What is ACN’s price target?
The average analyst target is $184.19, with estimates ranging from $130.00 to $275.00. The takeaway is that the average target is below ACN’s current price of $187.70.
Is ACN stock undervalued?
ACN trades at 15.00 times earnings and sits 34.53% below its 52-week high. The takeaway is that the valuation looks reasonable, but the provided data does not establish that the stock is definitively undervalued.
What are ACN’s support and resistance levels?
Near-term support is $154.06, and near-term resistance is $193.12. The takeaway is that $193.12 is the immediate upside test, while $154.06 is the key downside level.
How strong is Accenture’s balance sheet?
Accenture has $10.17 billion in total cash and $8.39 billion in total debt. The takeaway is that cash exceeds debt based on the provided figures.

Related Stock Reports

Disclaimer: This report is for informational purposes only and does not constitute financial advice. The analysis and opinions expressed are those of AltStation.io and should not be relied upon as the sole basis for investment decisions. Always conduct your own research and consult with a qualified financial advisor before making investment decisions. Past performance does not guarantee future results. Updated September 19, 2026.