ALTSTATION.IO

APA Corporation (APA) Stock Analysis

By Nova Skye | AltStation.io | Updated September 06, 2026

Price
$43.48
Change
-1.59%
Market Cap
$15.23B
Avg Volume
5.5M

Company Overview

Headquartered in Houston, Texas, APA Corporation is an independent energy company operating in the oil and gas exploration and production sector since 1954. The company extracts crude oil, natural gas, and natural gas liquids, selling those raw commodities directly to commercial refiners, utilities, and pipeline operators. Its primary production fields operate in the United States, Egypt, and the North Sea, complemented by high-potential exploration acreage in Suriname and Uruguay.

APA operates as a mid-tier challenger in the E&P space, competing for capital and acreage against larger independent operators like Devon Energy, EOG Resources, and Diamondback Energy. The company’s biggest edge is its geographic mix, using stable, cash-generative operations from its 27-year footprint in Egypt to fund operations beyond standard North American shale. The primary risk is exposure to international political friction and currency dynamics that purely domestic drillers do not face. In a commodity downturn, that extra operational complexity makes APA more volatile than its pure-play shale rivals.

Right now, APA is prioritizing debt reduction and operational efficiency over aggressive volume expansion. Second-quarter 2026 production stood at approximately 410,000 barrels of oil equivalent per day, supported by $1.7 billion in operating cash flow and a $2.3 billion total debt reduction since year-end 2024. Management is holding 2026 domestic capital spending to $1.3 billion, directing growth capital toward Block 58 in Suriname where APA holds a 50% interest targeting initial production in 2028. This setup positions APA as a disciplined cash-return story today with a massive deepwater production catalyst ahead.

Key Financials
Market Cap
$15.23B
Revenue
$8.57B
EBITDA
$5.72B
Gross Margin
78.3%
Profit Margin
19.6%
Revenue Growth
9.2%
Total Cash
$444.00M
Total Debt
$3.88B
Free Cash Flow
$2.15B


52-Week Price Performance Analysis

Price Statistics
P/E Ratio
9.17
Forward P/E
10.38
Beta
0.35
52-Week High
$45.66
52-Week Low
$21.57
EPS
$4.74
50-Day Avg
$37.65
200-Day Avg
$33.48
Price/Book
2.17
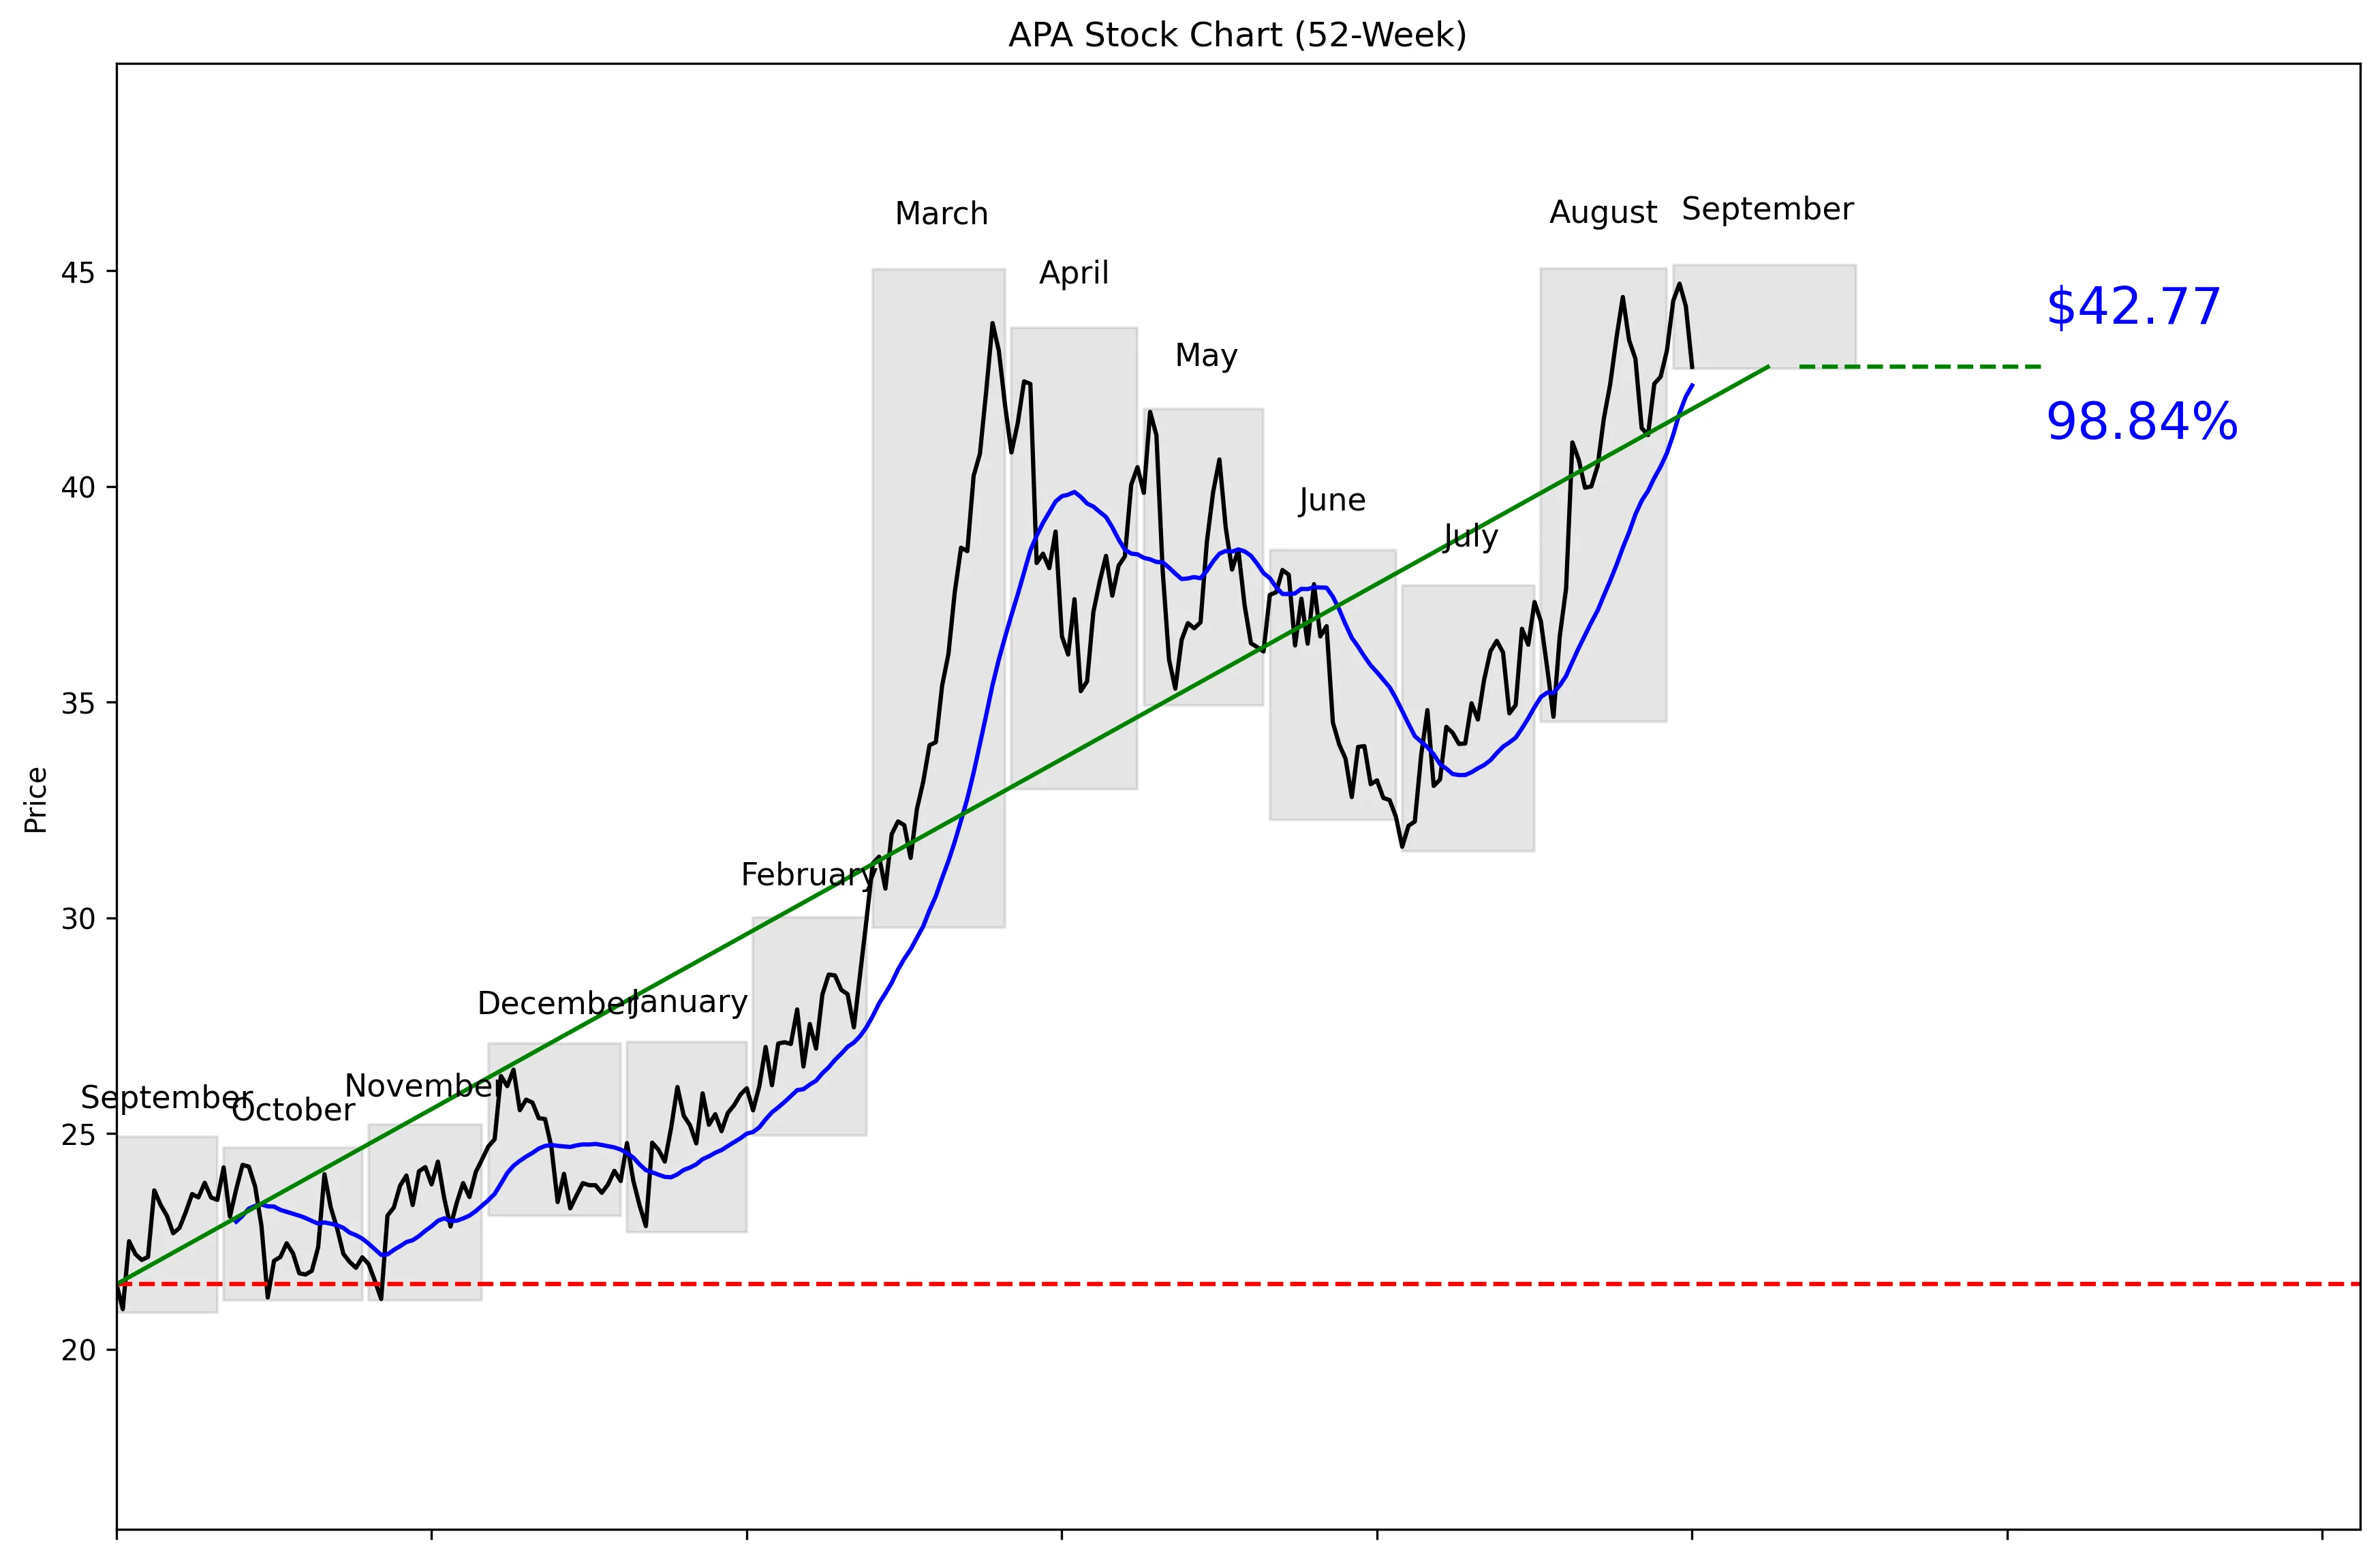
APA 52-Week Stock Chart
Technical Analysis
APA trades at $43.48, placing it 90% of the way from its $20.84 52-week low to its $45.13 high. The stock is 5.23% below that high and 105.20% above the low. It sits 1.02% above its 20-day moving average of $42.34. Momentum is positive at 0.54% over five trading days and 13.66% over 20 trading days. Near-term support is $34.66, while resistance is $44.70.


Recent News and Developments

APA farms down 40% of Uruguay Block 6 to Eni

APA agreed to transfer 40% of offshore Block 6 to Eni, subject to government approvals. APA will retain a 60% working interest and continue operating the block. Source: Clifford Chance

Raymond James lifts APA target to $54

Raymond James raised its APA price target from $50 to $54 and maintained an Outperform rating. Analyst John Freeman cited operating execution, debt reduction and APA’s plan to repurchase approximately $900 million of stock, or about 6% of shares outstanding, during the second half of 2026. Source: Investing.com

Wells Fargo raises APA target to $50

Wells Fargo increased its APA price target from $49 to $50 on September 2. The firm kept its Equal-Weight rating, signaling limited conviction despite the higher target. Source: GuruFocus


Market Sentiment and Analyst Recommendations

Bull Case
APA has $8.57 billion in revenue and revenue growth of 9.2%. The stock trades at 9.17 times earnings, which leaves room for upside if growth continues. Raymond James raised its price target from $50 to $54 and maintained an Outperform rating. The firm cited operating execution, debt reduction and APA’s plan to repurchase approximately $900 million of stock, or about 6% of shares outstanding, during the second half of 2026. APA also agreed to transfer 40% of Uruguay Block 6 to Eni while retaining a 60% working interest and remaining the operator, subject to government approvals. The bull case is straightforward: earnings are priced cheaply, revenue is growing, and the planned buyback could strengthen per-share results.
Bear Case
APA is already 90% of the way through its 52-week range, so buyers are entering close to the top rather than near a clear bargain level. The $43.48 price is also close to the $44.08 consensus analyst target. Analysts rate the stock hold based on 24 recommendations, which shows limited broad conviction. Total debt of $3.88 billion is far above total cash of $444 million. Wells Fargo raised its target to $50 but kept an Equal-Weight rating, while Seaport Global initiated coverage at Neutral. APA also fell 3.19% on September 4 and closed at $42.77 after reaching $45.13 on September 2, showing that sellers are active near the highs.
What to Watch
The first test is the $44.70 near-term resistance level. A sustained move above that level would put the $45.13 52-week high back in focus, while failure there would reinforce the current ceiling. Watch whether APA holds above its $42.34 20-day moving average after gaining 13.66% over the last 20 trading days. The planned $900 million repurchase during the second half of 2026 is a major catalyst because it represents about 6% of shares outstanding. Investors should also track government approval of the Block 6 transfer and APA’s execution while retaining its 60% operating interest. The downside threshold is $34.66; a move toward that 30-day low would break the current momentum thesis.
Analyst Consensus
HOLD

Based on 24 analyst opinions
Low Target
$31.00
Mean Target
$44.08
High Target
$54.00


Earnings and Financial Data

Sector
Energy
Industry
Oil & Gas E&P
Employees
1,791
Earnings & Dividends
Next Earnings
Nov 04, 2026
EPS (Trailing)
$4.74
Dividend Yield
224.0%
Payout Ratio
21.1%

Frequently Asked Questions

Is APA a good stock to buy?
APA trades at $43.48 with a hold recommendation from 24 analysts. The 9.17 P/E and 9.2% revenue growth are attractive, but the stock is already 90% of the way through its 52-week range; the takeaway is that APA looks more like a hold than an aggressive buy.
What is APA’s price target?
The analyst target is $44.08, with estimates ranging from $31.00 to $54.00. The takeaway is that analyst expectations vary widely and the consensus target sits close to the current $43.48 price.
What are APA’s support and resistance levels?
Near-term support is $34.66, and near-term resistance is $44.70. The takeaway is that APA is trading much closer to resistance than support at $43.48.
Is APA stock showing positive momentum?
APA gained 0.54% over the last five trading days and 13.66% over the last 20 trading days. The price is also 1.02% above its $42.34 20-day moving average, so the takeaway is that momentum remains positive.
How much debt does APA have?
APA has $3.88 billion in total debt and $444 million in total cash. The takeaway is that debt materially exceeds the company’s cash balance.

Related Stock Reports

Disclaimer: This report is for informational purposes only and does not constitute financial advice. The analysis and opinions expressed are those of AltStation.io and should not be relied upon as the sole basis for investment decisions. Always conduct your own research and consult with a qualified financial advisor before making investment decisions. Past performance does not guarantee future results. Updated September 06, 2026.