ALTSTATION.IO

EOG Resources, Inc. (EOG) Stock Analysis

By Nova Skye | AltStation.io | Updated September 06, 2026

Price
$145.72
Change
-0.16%
Market Cap
$76.43B
Avg Volume
3.4M

Company Overview

EOG Resources is a Houston-based exploration and production company in the energy sector that extracts and sells crude oil, natural gas liquids, and natural gas. Incorporated in 1985 after spinning off from Enron, the company primarily produces hydrocarbons across major American shale plays like the Permian Basin and Eagle Ford, along with offshore assets in Trinidad and Tobago. They sell raw commodities and condensate directly to refiners, petrochemical plants, and commercial marketers, while also running their own gathering, processing, and marketing networks.

EOG is an established market leader among independent upstream producers, competing directly with large operators like Devon Energy and Diamondback Energy. Their primary competitive edge is a strict focus on “premium wells,” requiring new drilling locations to generate high returns at low commodity prices before capital is deployed. The biggest threat to EOG is the wave of massive consolidation in the oil patch, highlighted by ExxonMobil acquiring Pioneer Natural Resources to create massive scale in the Permian Basin. While commodity price swings remain an unavoidable industry risk, EOG relies on low operating costs to protect margins better than bloated peers.

The company is currently in a phase of steady, disciplined cash generation rather than aggressive land grabs. In 2024, EOG generated 23.698 billion dollars in total revenue and 6.403 billion dollars in net income while achieving a 25 percent return on capital employed. Total production averaged 1,062.1 thousand barrels of oil equivalent per day for the full year 2024, surpassing its original operating plan. EOG is deliberately avoiding expensive corporate takeovers, choosing instead to drill high-margin organic acreage and return excess cash directly to shareholders.

Key Financials
Market Cap
$76.43B
Revenue
$26.72B
EBITDA
$14.49B
Gross Margin
62.6%
Profit Margin
25.7%
Revenue Growth
58.7%
Total Cash
$4.91B
Total Debt
$8.25B
Free Cash Flow
$4.48B


52-Week Price Performance Analysis

Price Statistics
P/E Ratio
11.57
Forward P/E
10.15
Beta
0.28
52-Week High
$153.67
52-Week Low
$101.59
EPS
$12.60
50-Day Avg
$141.30
200-Day Avg
$128.51
Price/Book
2.40
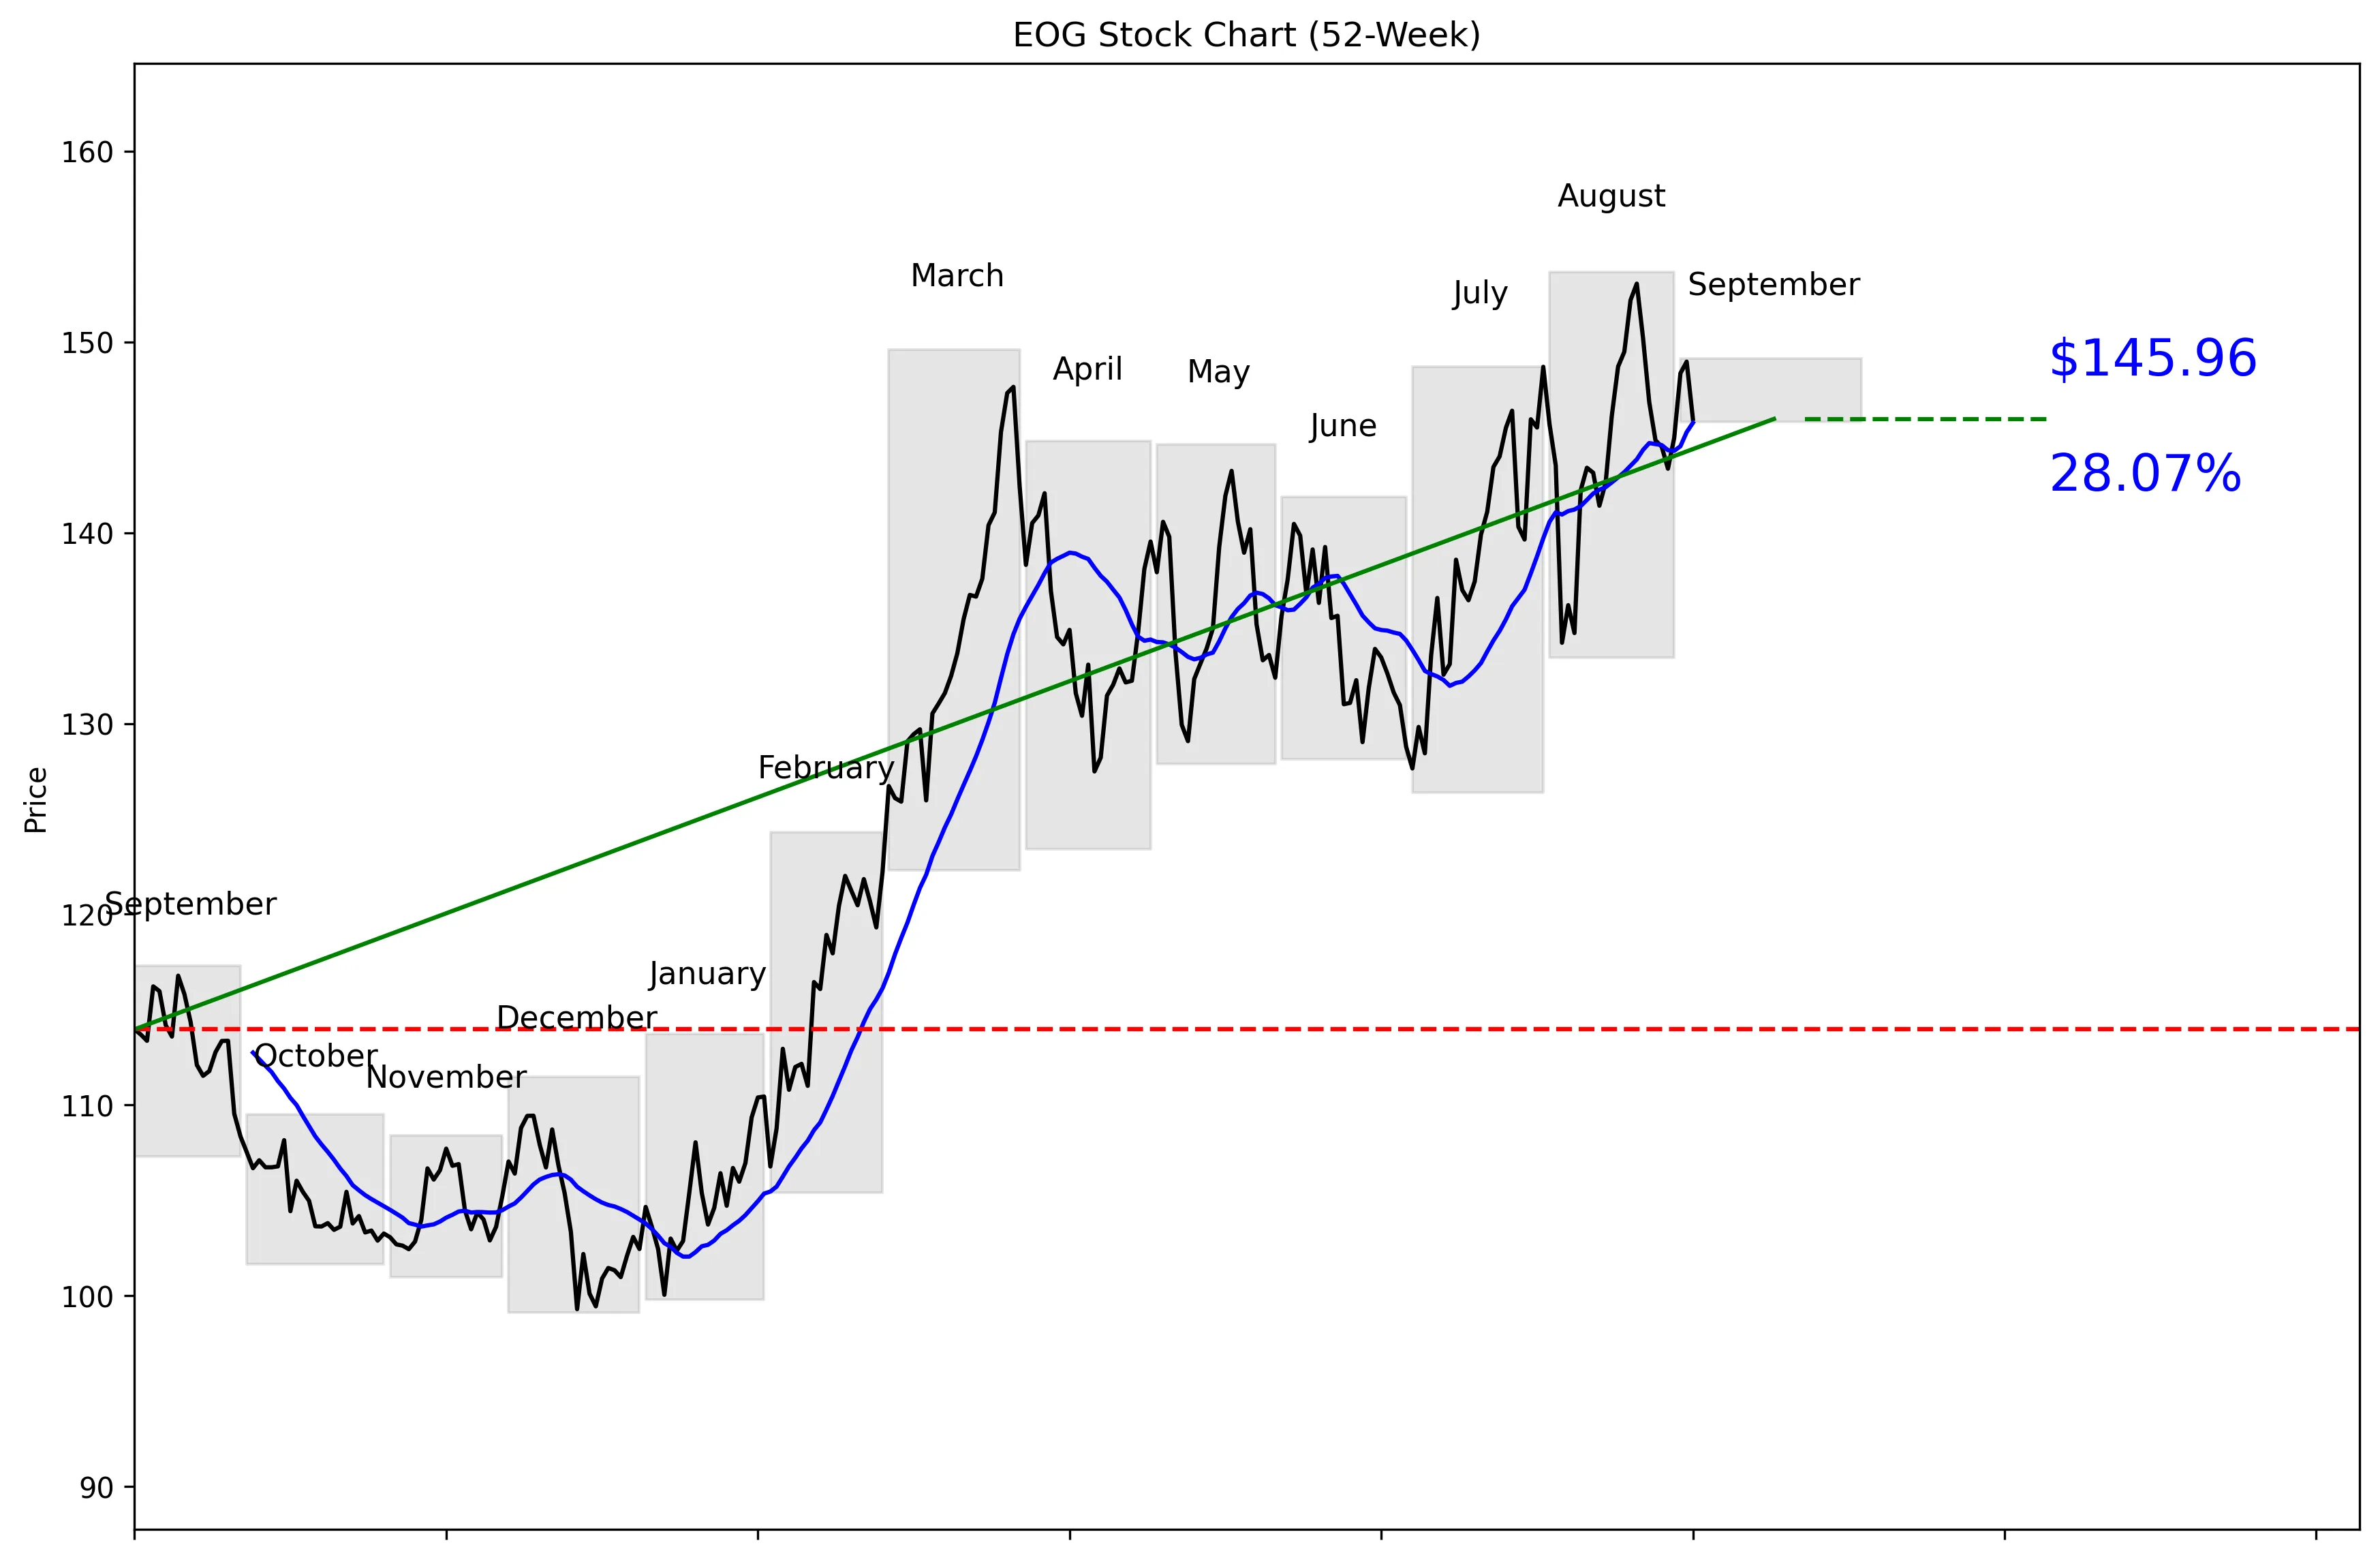
EOG 52-Week Stock Chart
Technical Analysis
EOG trades at $145.72, placing it 86% of the way from its technical 52-week low of $99.12 to its high of $153.67. The stock is 5.02% below that high and 47.26% above the low, so most of the recovery is already reflected in the price. It sits nearly flat against the 20-day moving average of $145.75, with the supplied price difference at 0.14%. Momentum remains positive at 1.01% over five trading days and 7.17% over 20 trading days. Near-term support is $134.23, while $153.05 is the resistance level buyers need to clear.


Recent News and Developments

Seaport starts EOG at Neutral

Seaport Research initiated coverage of EOG Resources with a Neutral rating on September 3. EOG was one of 10 upstream operators assigned Neutral ratings, while Devon Energy and Permian Resources were named the firm’s top picks. Source: TipRanks

EOG schedules Barclays conference presentation

EOG said Chief Operating Officer Jeffrey Leitzell will present at the Barclays 40th Annual Energy-Power Conference on September 9. The presentation begins at 9:45 a.m. Eastern, with a webcast and replay available through EOG’s investor site. Source: PR Newswire

EOG gains 1.29% for the week

EOG closed at $145.20 on September 4, up 1.29% from $143.35 on August 28. The stock jumped 2.34% on September 1, then surrendered part of the gain with a 2.01% decline on September 3. Source: Stock Analysis


Market Sentiment and Analyst Recommendations

Bull Case
Revenue growth of 58.7% is the strongest part of the EOG story. The company generates $26.72 billion in revenue and carries a $76.43 billion market cap. A P/E of 11.57 is reasonable for that growth rate and leaves room for further gains if operating performance holds. The consensus analyst target is $159.96, above the current $145.72 price, and 27 analysts collectively rate the stock a buy. The most bullish target reaches $193.00. Positive momentum of 7.17% over the past 20 trading days shows buyers are already responding. EOG is worth buying on a pullback, but chasing it near $153.05 resistance offers a less attractive setup.
Bear Case
EOG is trading just 5.02% below its 52-week high, so the easy upside may already be gone. The stock stands 47.26% above its 52-week low and is 86% through the annual range. Its $8.25 billion of debt exceeds its $4.91 billion cash position, limiting balance-sheet flexibility. The lowest analyst target is $134.00, below both the current $145.72 price and the $134.23 technical support level. Seaport Research initiated coverage at Neutral on September 3, showing that not every analyst sees EOG as a preferred upstream name. The stock also fell 2.01% on September 3 after jumping 2.34% on September 1, a reminder that recent gains can reverse quickly. At this price, slowing growth or a failure at $153.05 resistance would weaken the setup.
What to Watch
Chief Operating Officer Jeffrey Leitzell is scheduled to present at the Barclays 40th Annual Energy-Power Conference on September 9 at 9:45 a.m. Eastern. Investors should listen for information that supports the reported 58.7% revenue growth rate. The first technical test is $153.05 resistance, followed closely by the $153.67 52-week high. A clean move through those levels would strengthen the bullish trend. On the downside, $134.23 is the key near-term support level, with the lowest analyst target sitting at $134.00. Watch whether the price can hold near or above its $145.75 20-day moving average after gaining 7.17% over 20 trading days. The balance-sheet test is whether EOG can improve its $4.91 billion cash position relative to $8.25 billion in debt.
Analyst Consensus
BUY

Based on 27 analyst opinions
Low Target
$134.00
Mean Target
$159.96
High Target
$193.00


Earnings and Financial Data

Sector
Energy
Industry
Oil & Gas E&P
Employees
3,400
Earnings & Dividends
Next Earnings
Nov 05, 2026
EPS (Trailing)
$12.60
Dividend Yield
None
Payout Ratio
0%

Frequently Asked Questions

Is EOG a good stock to buy?
EOG has a buy recommendation from 27 analysts, 58.7% revenue growth, and a P/E of 11.57. The takeaway is that the fundamental case is positive, but the stock is already 86% of the way through its 52-week range.
What is EOG’s price target?
The analyst target is $159.96, with estimates ranging from $134.00 to $193.00. The takeaway is that analysts see upside potential, but their forecasts vary widely.
What is EOG’s 52-week high and low?
The technical price series shows a 52-week high of $153.67 and a low of $99.12. The takeaway is that EOG trades close to the top of that range at $145.72.
What are EOG’s support and resistance levels?
Near-term support is the 30-day low of $134.23, while resistance is the 30-day high of $153.05. The takeaway is that these are the key price levels to watch.
Does EOG pay a dividend?
The provided key and technical data do not include dividend information. The takeaway is that no dividend conclusion can be made from this dataset.

Related Stock Reports

Disclaimer: This report is for informational purposes only and does not constitute financial advice. The analysis and opinions expressed are those of AltStation.io and should not be relied upon as the sole basis for investment decisions. Always conduct your own research and consult with a qualified financial advisor before making investment decisions. Past performance does not guarantee future results. Updated September 06, 2026.