ALTSTATION.IO

ConocoPhillips (COP) Stock Analysis

By Nova Skye | AltStation.io | Updated September 13, 2026

Price
$136.56
Change
-0.35%
Market Cap
$164.06B
Avg Volume
7.0M

Company Overview

ConocoPhillips is a pure upstream oil and gas producer based in Houston, Texas, operating in the Energy sector since its founding in 1917. The company does not run retail gas stations or consumer refineries; instead, it explores for, produces, transports, and sells five core energy commodities: crude oil, bitumen, natural gas, liquefied natural gas (LNG), and natural gas liquids. Commercial refiners, industrial users, and utility providers buy these physical commodities across North America, Europe, and Asia Pacific markets. The business model is straightforward: extract hydrocarbons across its five global operating segments and sell them directly to wholesale off-takers at market rates.

ConocoPhillips sits as the dominant market leader among independent exploration and production companies, outpacing large-cap peers like EOG Resources and Devon Energy. Its main competitive edge is geographic depth across five key regions: Alaska, the Lower 48, Canada, Europe/Middle East/North Africa, and Asia Pacific. Holding low-cost North American shale alongside Canadian oil sands and international LNG assets protects cash flows far better than single-basin producers. The primary threat is direct commodity price volatility, since pure upstream operators have zero downstream refining operations to buffer against oil price declines.

Right now, ConocoPhillips is focused on high-margin asset development and capital discipline rather than reckless volume expansion. The company directs the vast majority of its capital budget into low cost-of-supply unconventional plays in North America and long-life projects in Alaska and global LNG. Management is deliberately prioritizing free cash flow generation and shareholder capital returns over speculative wildcat drilling. ConocoPhillips is built as a lean, low-breakeven cash machine, making it a top-tier vehicle for direct upside on global energy demand.

Key Financials
Market Cap
$164.06B
Revenue
$64.46B
EBITDA
$26.78B
Gross Margin
47.6%
Profit Margin
14.4%
Revenue Growth
35.5%
Total Cash
$7.69B
Total Debt
$23.29B
Free Cash Flow
$7.69B


52-Week Price Performance Analysis

Price Statistics
P/E Ratio
18.06
Forward P/E
14.09
Beta
0.13
52-Week High
$138.89
52-Week Low
$85.57
EPS
$7.56
50-Day Avg
$122.06
200-Day Avg
$113.45
Price/Book
2.51
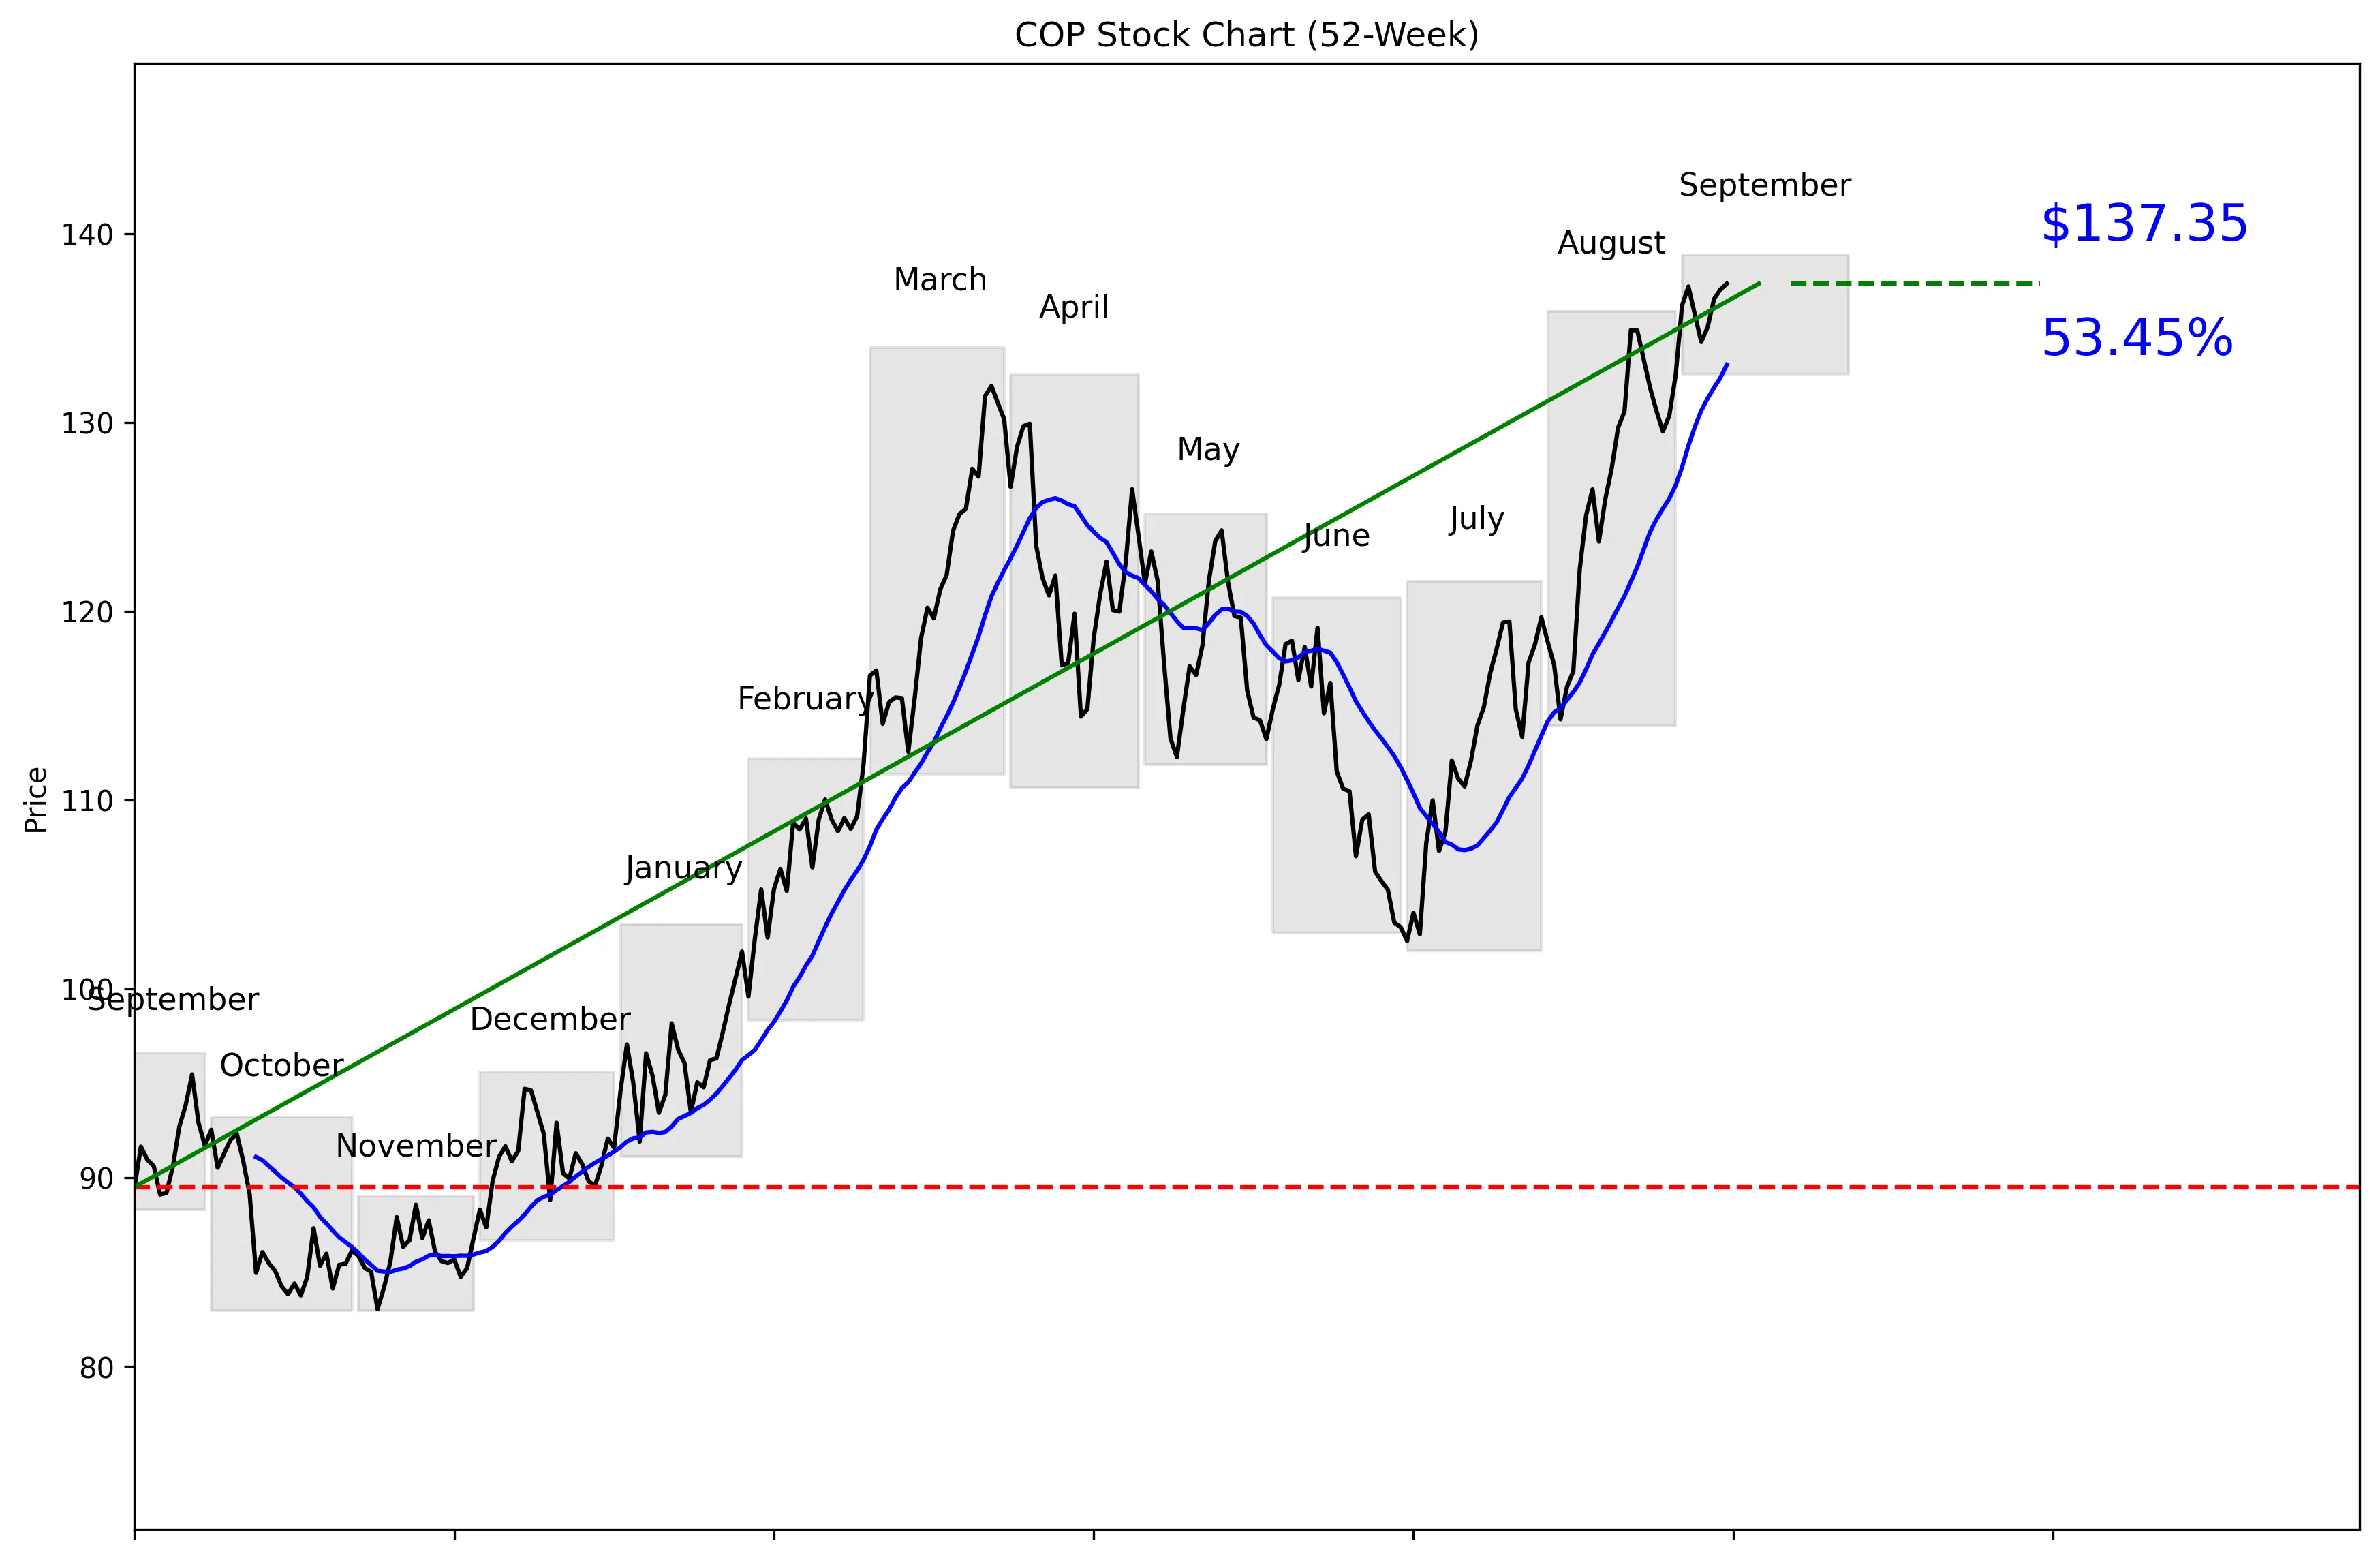
COP 52-Week Stock Chart
Technical Analysis
COP trades at $136.56, just 1.11% below its $138.89 52-week high and 65.57% above its $82.95 low. The stock sits 97% of the way from that low to the high, confirming a strong 52-week trend. Price is 3.23% above the 20-day moving average of $133.05. Momentum is positive at 1.20% over five trading days and 11.04% over 20 trading days. Near-term support is $114.28, while resistance is $137.35.


Recent News and Developments

Stifel starts COP at Hold with $148 target

Stifel Nicolaus initiated coverage of ConocoPhillips with a Hold rating and a $148 price target. That target represented 8.28% upside from the prior close, but the rating signals limited conviction after COP’s strong run. Source: MarketBeat

COP reaches a fresh 52-week high

ConocoPhillips rose 1.5% and traded as high as $137.53 on September 8, up from the previous close of $134.26. Momentum is strong, but the move pushed COP close to the reported analyst consensus target of $140.29. Source: MarketBeat

COP gains while the broader market falls

COP climbed 1.10% to $136.53 on September 9, its second consecutive gain. The move came while the S&P 500 fell 0.48% and the Dow dropped 0.77%. Source: MarketWatch


Market Sentiment and Analyst Recommendations

Bull Case
Revenue growth of 35.5% is the clearest reason to own COP. The company generates $64.46 billion in revenue and carries a $164.06 billion market cap. Analysts rate the stock a buy, based on 25 analysts, with a target of $145.44. The analyst range extends to $189.00, showing meaningful upside in the most optimistic case. COP also gained 1.10% to $136.53 on September 9 while the S&P 500 fell 0.48% and the Dow dropped 0.77%, a strong sign of relative demand. Andy O’Brien became CEO on September 1 with capital discipline, operational execution, and shareholder returns remaining central to the strategy.
Bear Case
COP is priced near perfection at 97% of the way through its 52-week range. At $136.56, the stock is already close to the $145.44 analyst target and above the $126.00 low-end target. Its P/E of 18.06 leaves less room for disappointment after an 11.04% advance over 20 trading days. Total debt of $23.29 billion is more than three times the company’s $7.69 billion in cash. Stifel initiated coverage with a Hold rating and a $148 target on September 10, signaling limited conviction after the run. The Manufacturers Life Insurance Company also reduced its stake by 1.7%, selling 31,652 shares during the second quarter, although it retained 1,816,143 shares.
What to Watch
The first threshold is $137.35, the 30-day resistance level; sustained trading above it would reinforce the current momentum. The next test is the $138.89 52-week high, with COP currently 1.11% below that level. On weakness, watch the $133.05 20-day moving average because the stock is currently 3.23% above it. A deeper reversal would put the $114.28 30-day support level into focus. Investors should track whether 35.5% revenue growth continues under Andy O’Brien, who took control on September 1. No future dated corporate event was provided, so the next-quarter thesis should center on price behavior, revenue growth, debt of $23.29 billion, cash of $7.69 billion, and movement toward or away from the $145.44 analyst target.
Analyst Consensus
BUY

Based on 25 analyst opinions
Low Target
$126.00
Mean Target
$145.44
High Target
$189.00


Earnings and Financial Data

Sector
Energy
Industry
Oil & Gas E&P
Employees
9,600
Earnings & Dividends
Next Earnings
Nov 05, 2026
EPS (Trailing)
$7.56
Dividend Yield
245.0%
Payout Ratio
43.6%

Frequently Asked Questions

Is COP a good stock to buy?
The recommendation is buy based on 25 analysts, and revenue growth is 35.5%. The takeaway is that analysts favor COP, but the stock is already near its 52-week high.
What is COP’s price target?
The analyst target is $145.44, with estimates ranging from $126.00 to $189.00. The takeaway is that analyst expectations vary widely.
What is COP’s 52-week high and low?
The technical price series shows a 52-week high of $138.89 and a low of $82.95. The takeaway is that COP trades close to the top of its annual range.
Is COP stock overvalued?
COP has a P/E ratio of 18.06 and trades 97% of the way from its 52-week low to its high. The takeaway is that the stock is strongly valued relative to its recent trading range.
What are COP’s support and resistance levels?
Near-term support is $114.28, and near-term resistance is $137.35. The takeaway is that COP is trading close to resistance at its current price of $136.56.

Related Stock Reports

Disclaimer: This report is for informational purposes only and does not constitute financial advice. The analysis and opinions expressed are those of AltStation.io and should not be relied upon as the sole basis for investment decisions. Always conduct your own research and consult with a qualified financial advisor before making investment decisions. Past performance does not guarantee future results. Updated September 13, 2026.