ALTSTATION.IO

Dow Inc. (DOW) Stock Analysis

By Nova Skye | AltStation.io | Updated September 19, 2026

Price
$30.20
Change
+1.19%
Market Cap
$21.82B
Avg Volume
10.1M

Company Overview

Dow Inc. is a basic materials heavyweight founded in 1897 and headquartered in Midland, Michigan. The company manufactures bulk chemicals, plastics, and coatings across three core operating segments. Its product lineup includes polyethylene resins, polyurethanes, chlorine, caustic soda, silicones, and architectural coatings. Dow sells these materials directly to industrial manufacturers in packaging, infrastructure, mobility, and consumer goods across North America, Europe, Asia Pacific, and Latin America. The business also runs a property and casualty insurance and reinsurance operation.

Dow is an established market leader and ranks as the world’s foremost supplier of polyethylene resin. Its Packaging and Specialty Plastics segment is the primary cash engine, generating roughly 50 percent of total company revenue. Massive global scale gives Dow a clear cost advantage in basic feedstocks like ethylene and propylene over smaller chemical producers. The key risk is heavy commodity cyclicality. Swings in energy input costs and basic chemical pricing create volatile margin pressure across industrial cycles.

Dow currently stands as an entrenched cyclical value play rather than a high-growth business. The company remains focused on operational efficiency and defending market share in core plastics and infrastructure materials across its global footprint. Because product demand tracks global manufacturing activity, top-line growth is tied directly to industrial output and consumer packaging volumes. If you are trading this stock, you are betting on cash flow stability and commodity cycle timing, not runaway expansion.

Key Financials
Market Cap
$21.82B
Revenue
$41.32B
EBITDA
$3.96B
Gross Margin
9.8%
Profit Margin
-3.1%
Revenue Growth
19.7%
Total Cash
$4.24B
Total Debt
$19.44B
Free Cash Flow
$237.62M


52-Week Price Performance Analysis

Price Statistics
P/E Ratio
N/A
Forward P/E
16.64
Beta
0.42
52-Week High
$42.74
52-Week Low
$20.65
EPS
$-1.83
50-Day Avg
$30.20
200-Day Avg
$31.70
Price/Book
1.38
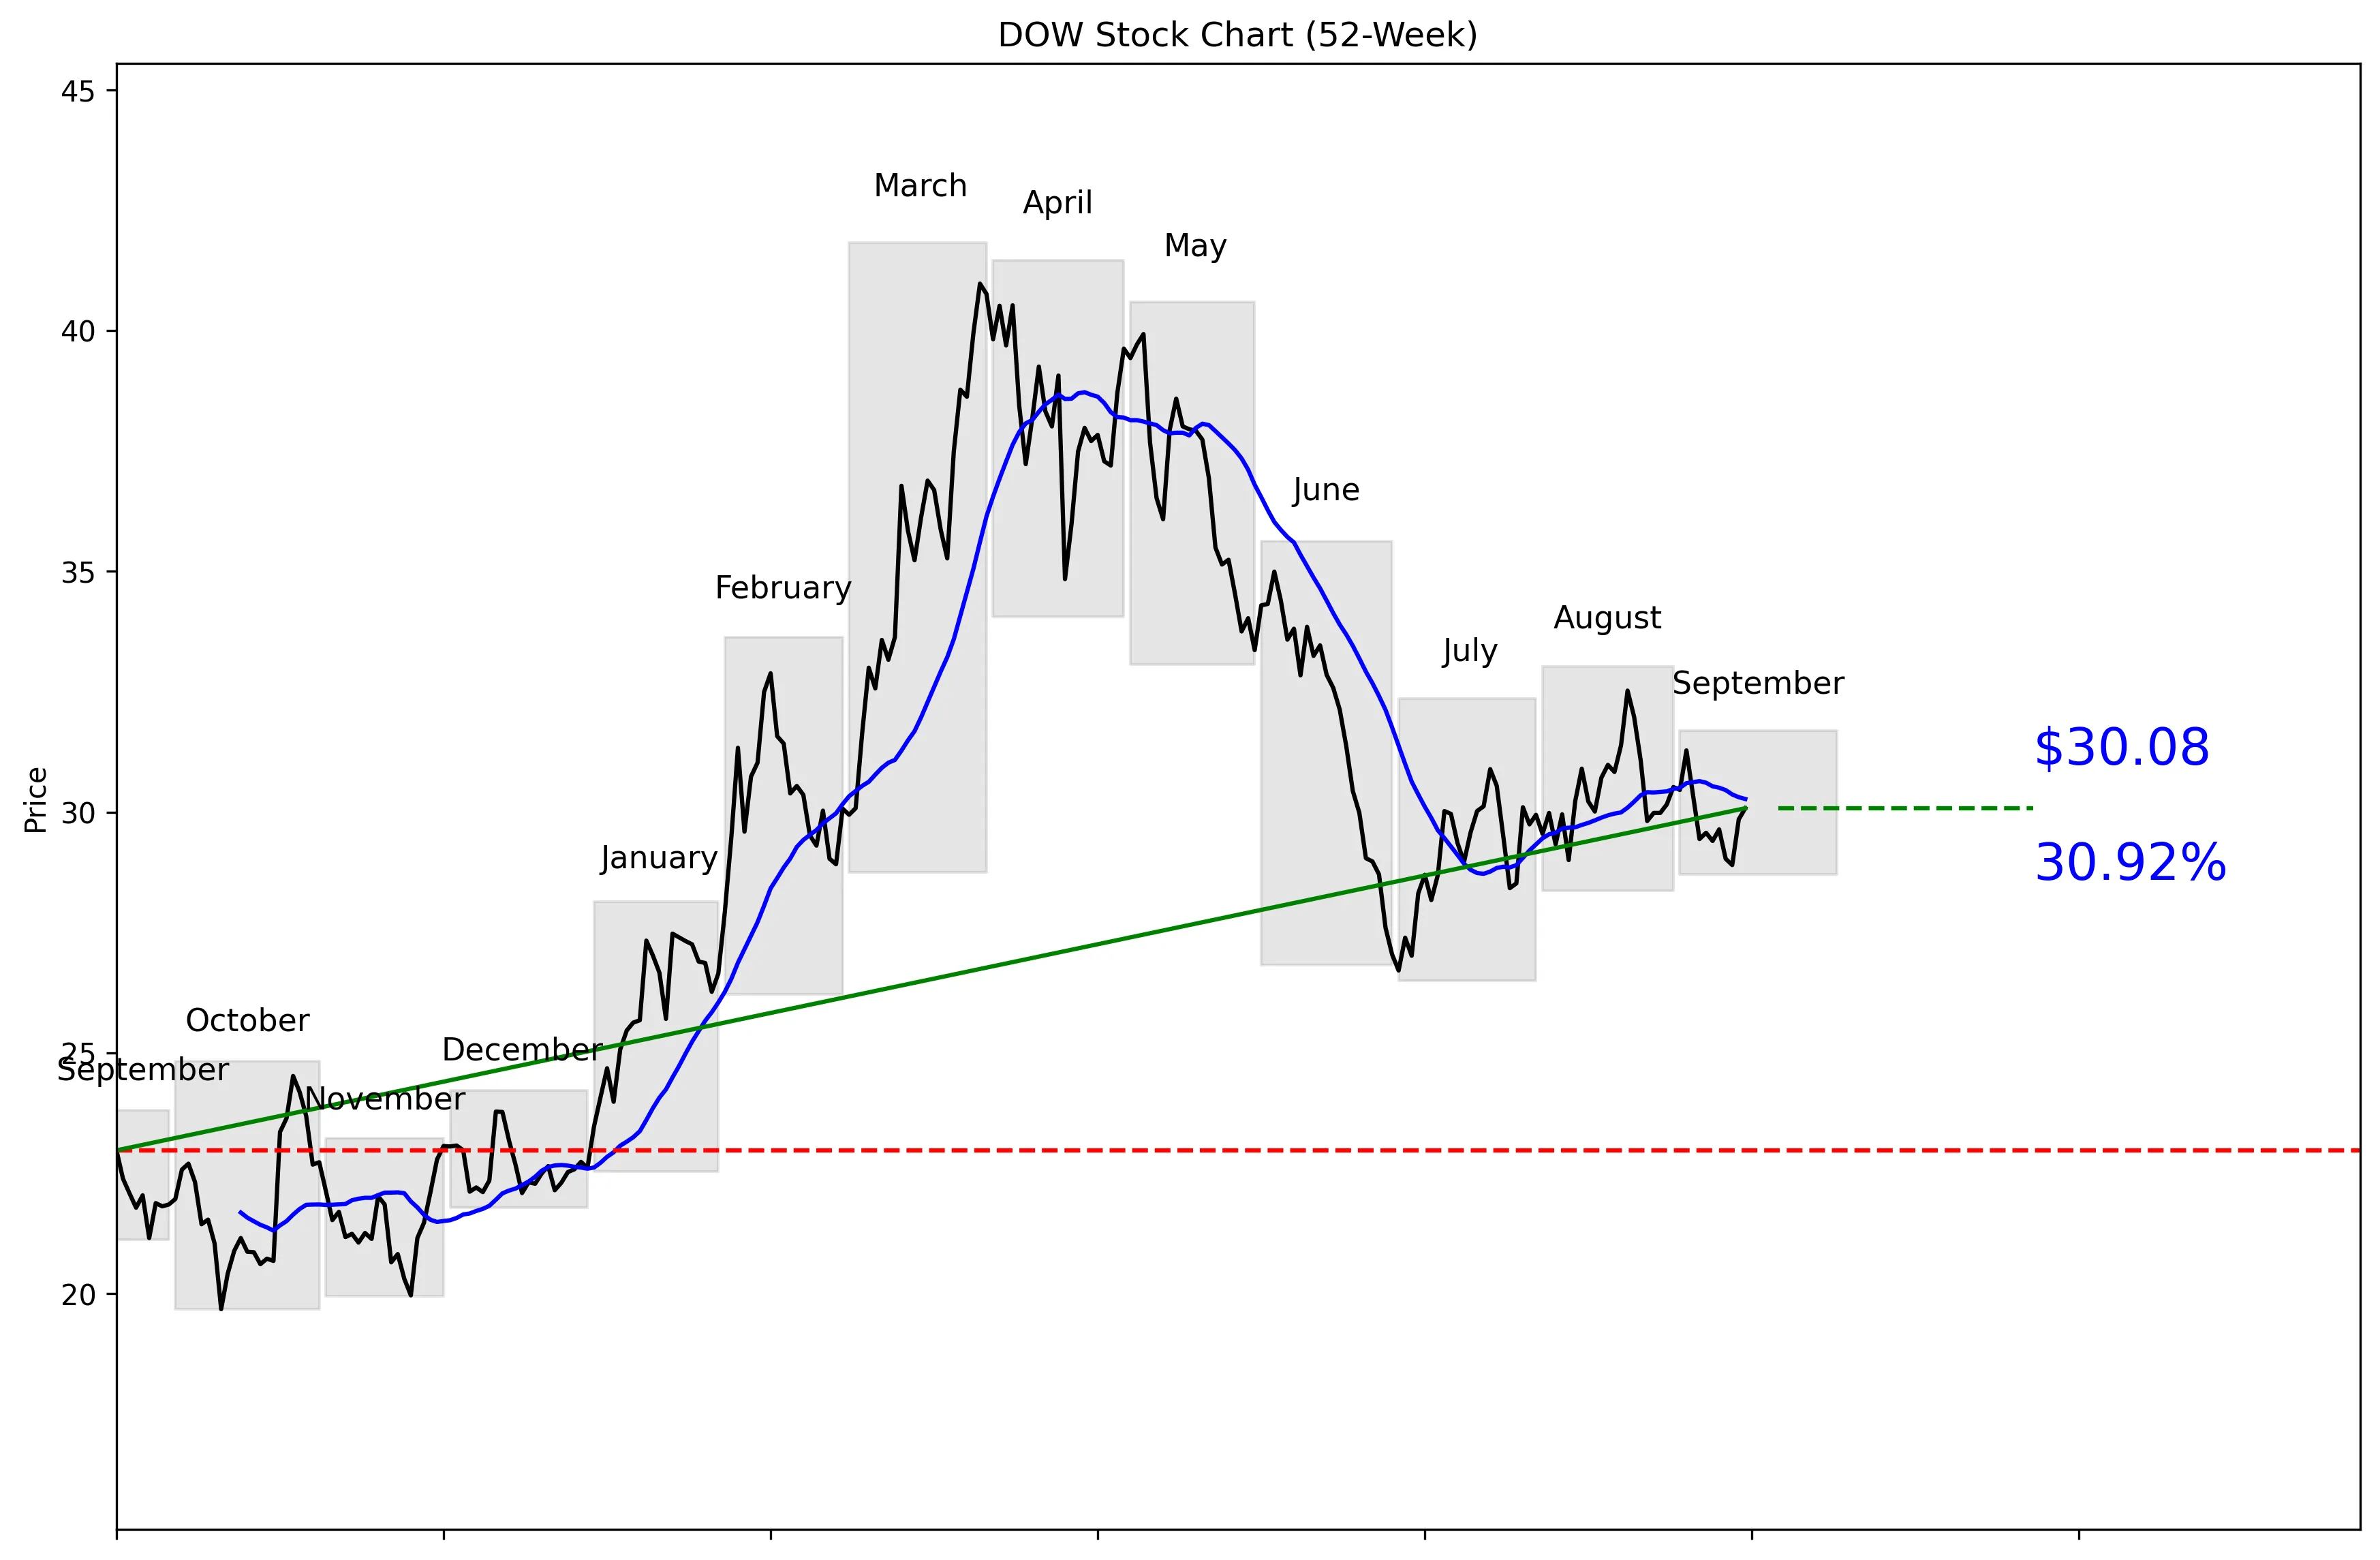
DOW 52-Week Stock Chart
Technical Analysis
DOW trades at $30.20, 47% of the way between its exact 52-week low of $19.68 and high of $41.82. The stock is 28.08% below that high but 52.86% above the low. Price sits 0.63% below the 20-day moving average of $30.27, while 20-day momentum is negative 2.44%. Five-day momentum has improved to 2.31%, showing a short-term bounce inside a weaker monthly trend. Near-term support is $28.90, and resistance is $32.52.


Recent News and Developments

Dow expands North American cleaning-products partnership

Univar Solutions expanded its agreement with Dow to distribute SupraCare polymers and specialty additives across the United States and Canada. The products target dishwashing, laundry care and industrial cleaning applications. Source: GlobeNewswire

Dow guides for $1.5 billion to $1.6 billion in third-quarter EBITDA

Dow expects third-quarter EBITDA of $1.5 billion to $1.6 billion despite mixed demand and weaker polyethylene pricing early in the quarter. Management also expects $1.3 billion in total self-help benefits during 2026 and more than $500 million of working-capital release in the second half. Source: Stock Analysis

Dow says 70% of planned role reductions are complete

Dow has implemented approximately 70% of its planned role reductions and expects nearly all of them to be completed by year-end. The cuts are expected to add more than $200 million to second-half EBITDA, while sourcing and contract changes should save another $70 million. Source: Stock Analysis


Market Sentiment and Analyst Recommendations

Bull Case
Revenue growth of 19.7% is the clearest reason to consider DOW at $30.20. Management expects third-quarter EBITDA of $1.5 billion to $1.6 billion despite mixed demand and weaker polyethylene pricing early in the quarter. Dow also expects $1.3 billion in self-help benefits during 2026 and more than $500 million of working-capital release in the second half. Approximately 70% of planned role reductions are complete, with the cuts expected to add more than $200 million to second-half EBITDA. Sourcing and contract changes should contribute another $70 million in savings. The $100 million siloxanes investment targets higher-growth uses including autonomous-vehicle sensors and advanced chips, while the expanded Univar partnership broadens distribution across the United States and Canada. The analyst target is $34.69, and 16 analysts collectively rate the stock a buy.
Bear Case
Dow carries $19.44 billion in total debt against $4.24 billion in cash, creating a clear balance-sheet risk. The company has no available P/E ratio in the supplied data, so investors cannot use that metric to establish whether the shares are cheap. Management is dealing with mixed demand and weaker polyethylene pricing, which could pressure operating performance. Cost cuts are doing significant work in the current thesis, including more than $200 million of expected second-half EBITDA from role reductions and another $70 million from sourcing and contract changes. Jefferies cut its price target from $34 to $32 and maintained a Hold rating on September 16. The broader analyst target range starts at $29.00, below the current $30.20 price. A break below $28.90 support would weaken the near-term setup, while the negative 2.44% 20-day momentum shows that buyers have not taken control.
What to Watch
Third-quarter EBITDA is the first test, with management guiding to $1.5 billion to $1.6 billion. Investors should track whether the company delivers the expected $1.3 billion in 2026 self-help benefits. The planned release of more than $500 million in working capital during the second half is another critical execution target. Role reductions were approximately 70% complete, and management expects nearly all of them finished by year-end. Watch whether the cuts produce more than $200 million in second-half EBITDA and whether sourcing and contract changes deliver another $70 million. On the chart, $28.90 is the downside threshold and $32.52 is the upside hurdle. Holding above $28.90 while reclaiming the $30.27 moving average would improve the setup; failure at those levels would keep the stock under pressure.
Analyst Consensus
BUY

Based on 16 analyst opinions
Low Target
$29.00
Mean Target
$34.69
High Target
$42.00


Earnings and Financial Data

Sector
Basic Materials
Industry
Chemicals
Employees
32,800
Earnings & Dividends
Next Earnings
Oct 22, 2026
EPS (Trailing)
$-1.83
Dividend Yield
469.0%
Payout Ratio
700.0%

Frequently Asked Questions

Is DOW a good stock to buy?
DOW has a buy recommendation from 16 analysts and revenue growth of 19.7%. The stock trades at $30.20 versus an analyst target of $34.69, but its P/E is unavailable. Takeaway: Analysts are positive, but valuation visibility is limited.
What is DOW’s price target?
The analyst target is $34.69, with estimates ranging from $29.00 to $42.00. DOW currently trades at $30.20. Takeaway: The consensus target is above the current price, but the low estimate is below it.
What is DOW’s 52-week trading range?
The supplied key data lists a 52-week range of $20.65 to $42.74, while the exact technical price series shows a low of $19.68 and a high of $41.82. The current price sits 47% of the way from the technical low to the technical high. Takeaway: DOW is near the middle of its exact technical range.
What are DOW’s support and resistance levels?
Near-term support is the 30-day low of $28.90, and near-term resistance is the 30-day high of $32.52. The current price is $30.20. Takeaway: DOW is trading between clearly defined near-term levels.
How much cash and debt does Dow have?
Dow has $4.24 billion in total cash and $19.44 billion in total debt. Its market capitalization is $21.82 billion. Takeaway: Debt materially exceeds cash and deserves close attention.

Related Stock Reports

Disclaimer: This report is for informational purposes only and does not constitute financial advice. The analysis and opinions expressed are those of AltStation.io and should not be relied upon as the sole basis for investment decisions. Always conduct your own research and consult with a qualified financial advisor before making investment decisions. Past performance does not guarantee future results. Updated September 19, 2026.