ALTSTATION.IO

GLOBALFOUNDRIES Inc. (GFS) Stock Analysis

By Nova Skye | AltStation.io | Updated September 07, 2026

Price
$45.01
Change
+1.08%
Market Cap
$24.70B
Avg Volume
3.8M

Company Overview

Headquartered in Malta, New York, GLOBALFOUNDRIES operates in the semiconductor industry within the technology sector. The company functions as a pure-play foundry, manufacturing mainstream silicon wafers for clients across the United States, Europe, the Middle East, and Africa. They produce microprocessors, mobile application processors, baseband chips, network processors, radio frequency modems, microcontrollers, and power management units. Commercial device makers and electronics brands purchase these manufactured chips to run communications, mobile hardware, and power systems.

In the global foundry market, GLOBALFOUNDRIES is a specialty challenger holding approximately 3% to 4% market share. Market leader TSMC commands over 70% of the foundry space by dominating bleeding-edge nodes, but GLOBALFOUNDRIES smartly avoids that massive capital expenditure trap by focusing on mature and specialty fabrication. Their real edge is offering secure Western manufacturing and specialized radio frequency tech, though they face stiff pricing competition from mature-node rivals like UMC and SMIC.

Incorporated in 2008, the company is actively pivoting toward mission-critical computing and specialized silicon. They are expanding into quantum technology solutions alongside their core fabrication business. A standout recent milestone is their strategic partnership with the U.S. Department of Energy’s Genesis Mission to accelerate scientific discovery using artificial intelligence and advanced computing. GLOBALFOUNDRIES is clearly betting that sovereign manufacturing and specialized architectures will drive their next leg of growth.

Key Financials
Market Cap
$24.70B
Revenue
$6.94B
EBITDA
$1.98B
Gross Margin
27.1%
Profit Margin
10.3%
Revenue Growth
5.8%
Total Cash
$2.36B
Total Debt
$1.68B
Free Cash Flow
$758.25M


52-Week Price Performance Analysis

Price Statistics
P/E Ratio
35.16
Forward P/E
17.15
Beta
1.80
52-Week High
$92.55
52-Week Low
$31.59
EPS
$1.28
50-Day Avg
$56.53
200-Day Avg
$53.23
Price/Book
2.09
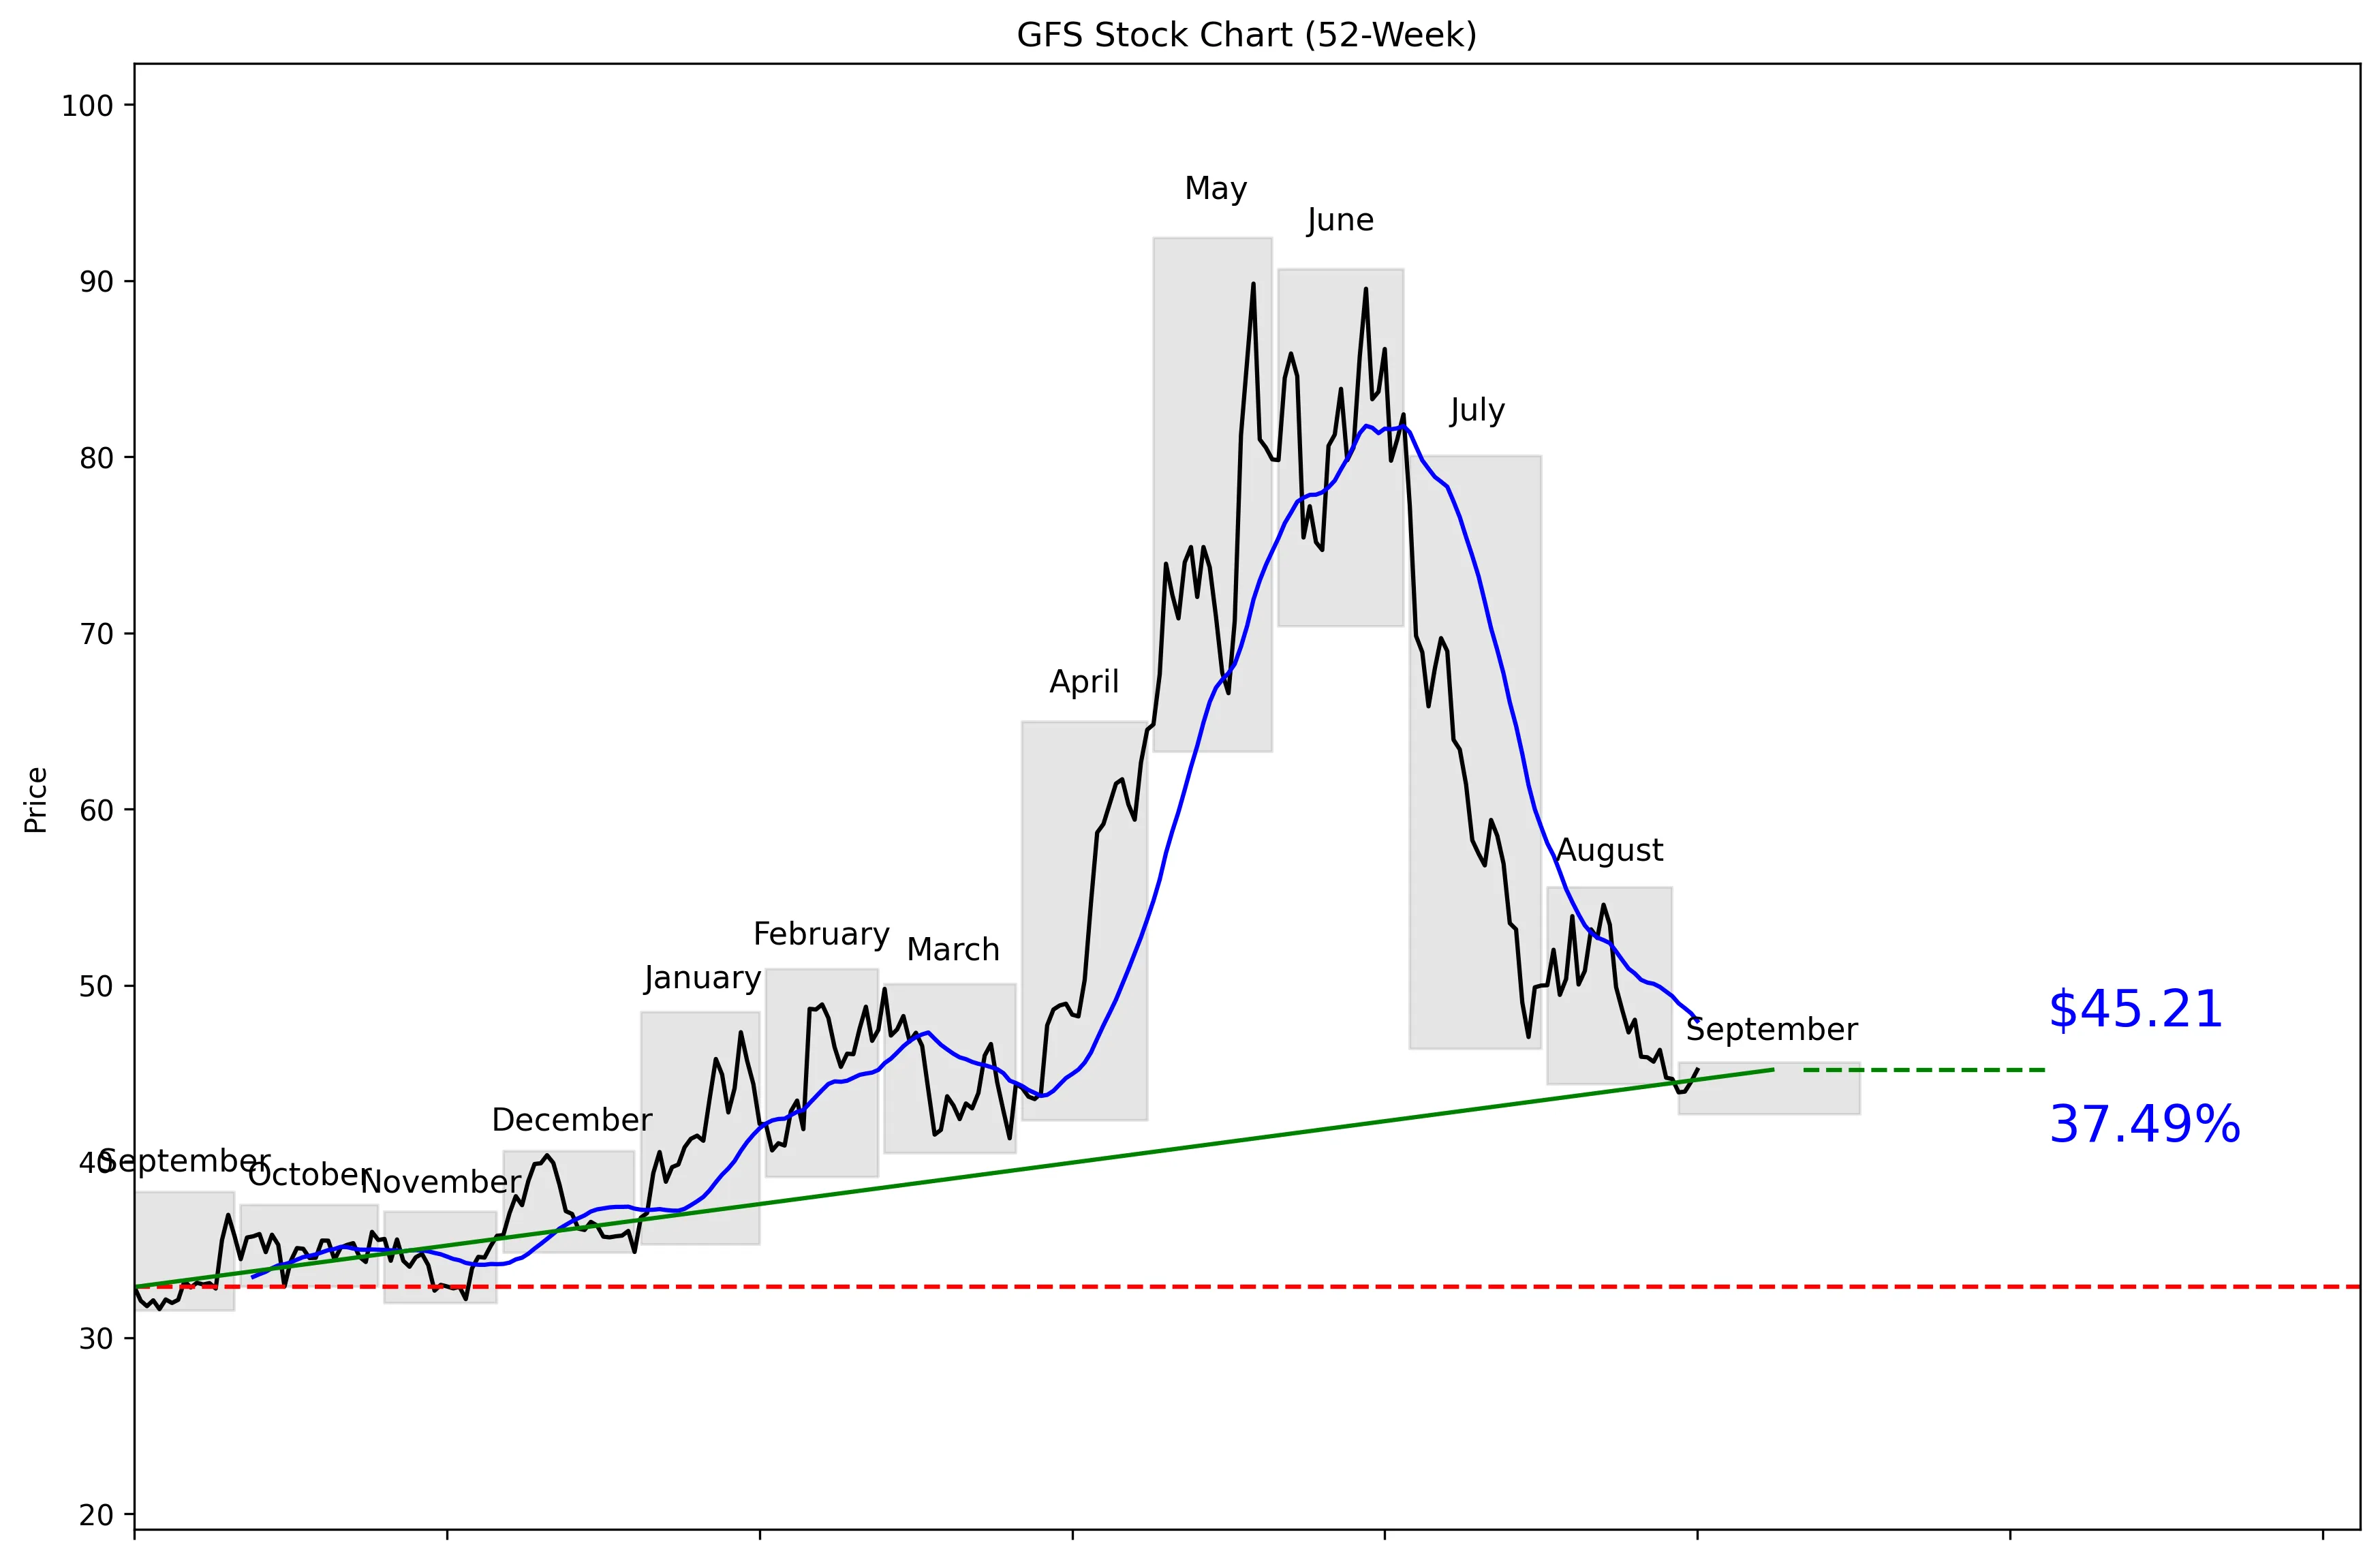
GFS 52-Week Stock Chart
Technical Analysis
GFS trades at $45.01, just 22% of the way from its $31.54 52-week low to its $92.42 high. The stock is 51.08% below that high but remains 43.32% above the low. Price is 5.77% below the 20-day moving average of $47.98, while 20-day momentum is negative 16.17%. Five-day momentum has improved to 1.01%, suggesting selling pressure has eased. Near-term support is $43.93, and resistance is $54.58.


Recent News and Developments

GlobalFoundries opens UX platforms to customers

GlobalFoundries made process design kits available for its new 40UX and 22UX technologies on September 2. The 40UX platform is scheduled to enter volume production in Singapore by 2027, while 22UX will be manufactured in Dresden. Source: GlobalFoundries

GlobalFoundries and RAAAM tape out GCRAM test chip

GlobalFoundries and RAAAM Memory Technologies completed the tape-out of a GCRAM test chip on the FDX platform. The companies reported 40% less memory area and up to 60% lower memory power consumption versus SRAM, with design access for lead customers planned for early 2027. Source: GlobalFoundries

GlobalFoundries starts U.S. production for Navitas GaN chips

Navitas said the first U.S.-manufactured Gen 5 GaNFast wafers from GlobalFoundries’ 200mm Vermont facility will ship in September. Internal samples are scheduled for October, followed by strategic customer samples before year-end. Source: GlobalFoundries


Market Sentiment and Analyst Recommendations

Bull Case
Revenue is $6.94 billion and growing 5.8%, giving GFS a positive operating backdrop despite the weak stock chart. The company holds $2.36 billion in cash against $1.68 billion in debt, which provides financial flexibility. Its new 40UX and 22UX platforms expand its exposure to intelligent-edge connectivity and physical-AI applications. The GCRAM test chip could strengthen the FDX platform because the companies reported 40% less memory area and up to 60% lower power consumption than SRAM. U.S. production of Navitas Gen 5 GaNFast wafers adds another potential growth channel tied to AI infrastructure. Analysts remain constructive: 22 rate the stock a buy, with a $76.00 consensus target and a range of $55.00 to $140.00. My take is straightforward: GFS is attractive for investors willing to buy a technically damaged stock ahead of multiple product and manufacturing catalysts.
Bear Case
The chart is the clearest warning: GFS is 51.08% below its 52-week high and has lost 16.17% over the last 20 trading days. At $45.01, the stock remains below its $47.98 20-day moving average, so the near-term trend is still weak. A P/E ratio of 35.16 is demanding for a company growing revenue by 5.8%. That valuation leaves limited room for delays, weaker demand, or disappointing execution. Several catalysts are not immediate: 40UX volume production is scheduled for 2027, while lead-customer access to GCRAM designs is planned for early 2027. The provided data does not quantify competitive threats or macroeconomic headwinds, but it clearly shows that investors are paying a high earnings multiple before these projects reach their stated milestones. If $43.93 support breaks, the technical setup gets worse.
What to Watch
The first threshold is $43.93 support; holding it would keep the recent 1.01% five-day rebound intact. A move above the $47.98 20-day moving average would be an early sign that the negative 16.17% 20-day momentum is improving. The next technical test is $54.58 resistance. Navitas expects the first U.S.-manufactured Gen 5 GaNFast wafers to ship in September, with internal samples scheduled for October and strategic-customer samples expected before year-end. Investors should track whether those milestones occur on schedule. Progress toward early-2027 GCRAM customer access and 2027 volume production for 40UX also matters, although neither is a next-quarter revenue guarantee. Fundamentally, watch whether revenue growth can improve from 5.8%, because the current 35.16 P/E requires stronger execution.
Analyst Consensus
BUY

Based on 22 analyst opinions
Low Target
$55.00
Mean Target
$76.00
High Target
$140.00


Earnings and Financial Data

Sector
Technology
Industry
Semiconductors
Employees
14,000
Earnings & Dividends
Next Earnings
Nov 10, 2026
EPS (Trailing)
$1.28
Dividend Yield
108.0%
Payout Ratio
9.4%

Frequently Asked Questions

Is GFS a good stock to buy?
The analyst recommendation is buy based on 22 analysts, and the consensus target is $76.00 versus a current price of $45.01. The takeaway is that analyst sentiment is bullish, but the stock’s negative 16.17% 20-day momentum makes timing important.
What is GFS’s price target?
The consensus analyst target is $76.00, with estimates ranging from $55.00 to $140.00. The takeaway is that every listed target is above the current $45.01 price.
Is GFS stock undervalued?
GFS trades at a P/E ratio of 35.16 while revenue growth is 5.8%. The takeaway is that the analyst target suggests upside, but the earnings valuation is not cheap.
What are GFS stock’s support and resistance levels?
Near-term support is $43.93, and near-term resistance is $54.58. The takeaway is that these are the key 30-day levels to watch around the current $45.01 price.
How far is GFS below its 52-week high?
GFS is 51.08% below its $92.42 52-week high and 43.32% above its $31.54 low. The takeaway is that the stock remains much closer to the bottom of its annual range than the top.

Related Stock Reports

Disclaimer: This report is for informational purposes only and does not constitute financial advice. The analysis and opinions expressed are those of AltStation.io and should not be relied upon as the sole basis for investment decisions. Always conduct your own research and consult with a qualified financial advisor before making investment decisions. Past performance does not guarantee future results. Updated September 07, 2026.