
Intel Corporation (INTC) Stock Analysis
By Nova Skye | AltStation.io | Updated September 19, 2026
Company Overview
Intel Corporation is a Santa Clara, California-based semiconductor company operating in the technology sector since its incorporation in 1968. The business runs across three core operating segments: Client Computing Group, Data Center and AI, and Intel Foundry. Its product line covers client and server CPUs, discrete graphics processors, edge computing hardware, connectivity products, and autonomous driving solutions. Intel sells these products and wafer fabrication services directly to original equipment manufacturers, cloud service providers, and third-party distributors across global markets.
Intel holds a legacy leadership position in traditional computing, but it functions as an aggressive challenger in discrete GPUs and dedicated AI hardware. Its primary competitive edge is vertical integration, controlling proprietary wafer fabrication and substrate manufacturing across facilities in the United States, Ireland, and Israel. The major headwind is the immense operational overhead of managing in-house manufacturing while simultaneously defending data center market share from specialized chip designers.
Intel is currently in the middle of a massive strategic pivot, transforming its manufacturing arm into a standalone foundry business to produce chips for external customers. On the enterprise software front, the company recently established a strategic collaboration with Infosys Limited to deploy a composable, multi-layer AI fabric across modern workloads. This shift changes Intel from a pure-play device maker into a hybrid provider of silicon architecture, contract fabrication, and enterprise AI infrastructure.
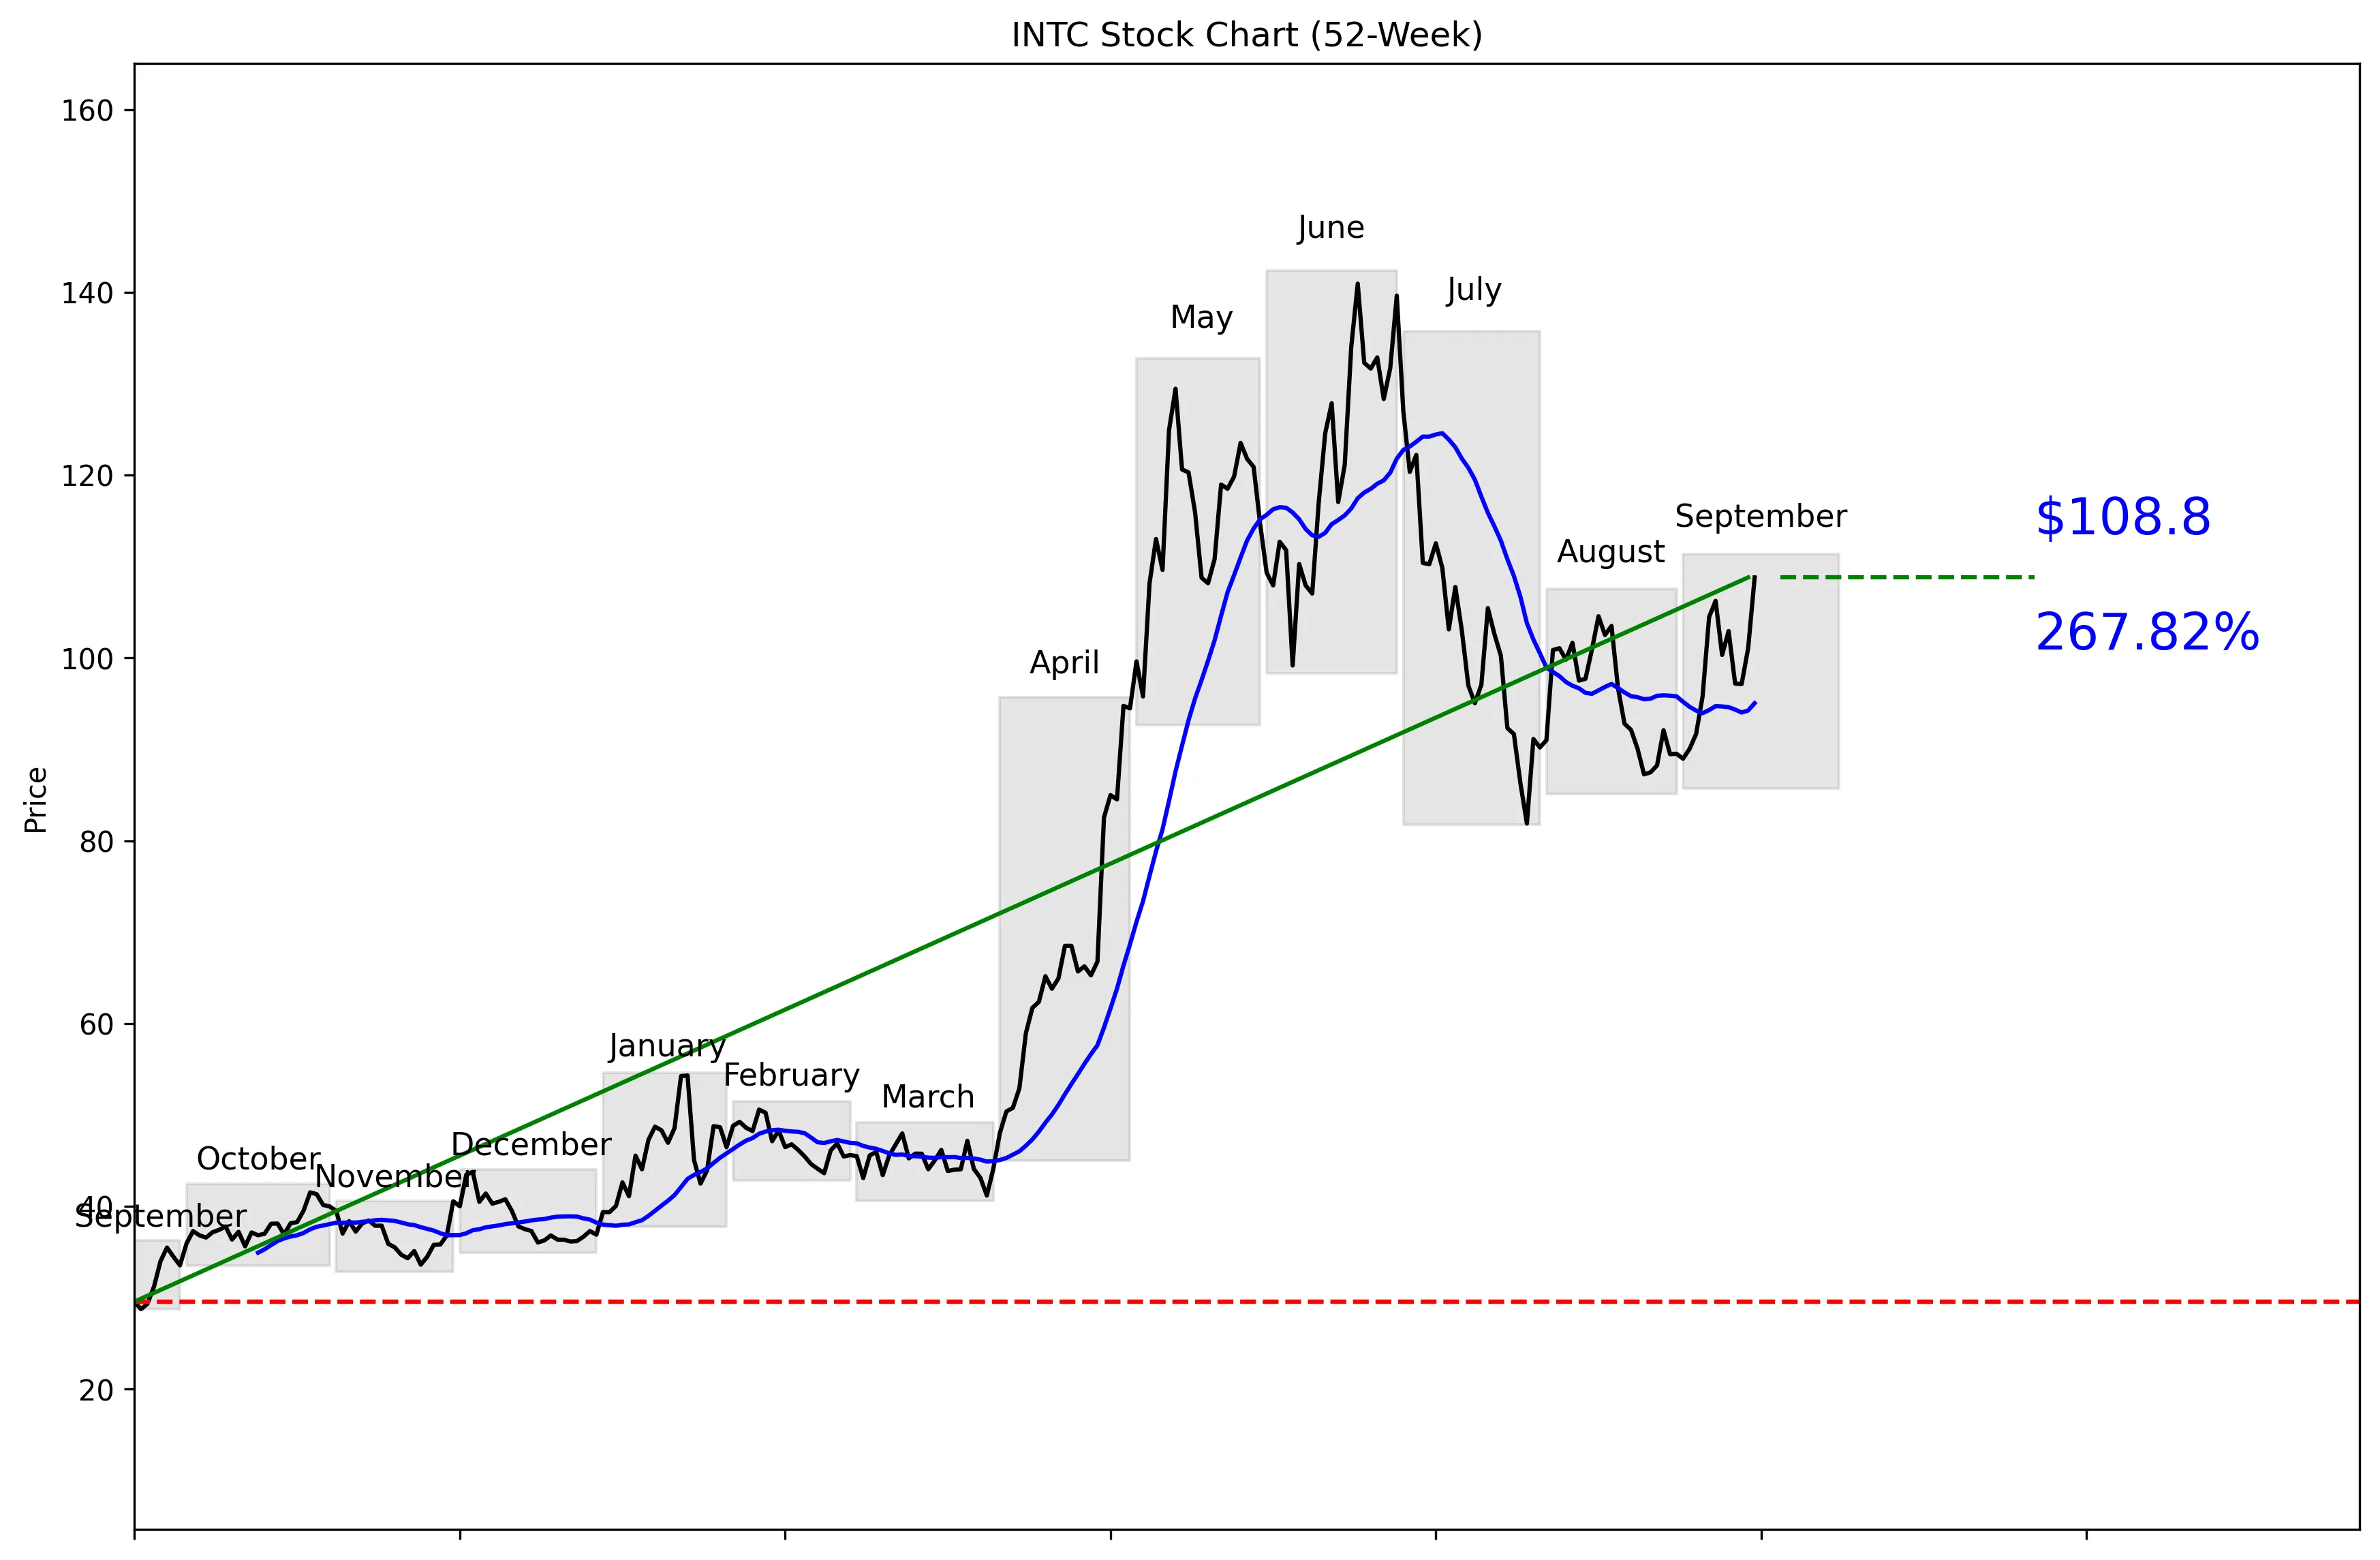
52-Week Price Performance Analysis
Recent News and Developments
No recent news available.
No recent news available.
No recent news available.
Market Sentiment and Analyst Recommendations
Earnings and Financial Data
Frequently Asked Questions
Related Stock Reports