ALTSTATION.IO

ON Semiconductor Corporation (ON) Stock Analysis

By Nova Skye | AltStation.io | Updated October 30, 2026

Price
$70.41
Change
-6.43%
Market Cap
$27.41B
Avg Volume
10.1M

Company Overview

Incorporated in 1992 and based in Scottsdale, Arizona, ON Semiconductor Corporation operates in the technology sector with a focus on power management and intelligent sensing hardware. The company designs and sells discrete power modules, analog mixed-signal chips, and specialized image sensors through three dedicated business segments. Their products handle critical functions like power conversion, circuit protection, depth sensing, and photon counting. Primary customers include manufacturers in the automotive, industrial automation, AI data center, computing, and mobile device markets across the United States, Europe, and Asia.

ON positions itself as a specialized hardware provider rather than a broad-market digital processor maker. Their key competitive advantage comes from pairing power-switching and signal conditioning components with advanced CMOS and short-wave infrared sensing technologies. The main threats come from broad-line semiconductor rivals competing for socket space in industrial robotics, vehicle safety systems, and cloud computing infrastructure. Defending their market share requires maintaining technical leadership in high-reliability power delivery and precision imaging.

The company is actively aligned with the industry-wide expansion into AI data centers, robotics, and automated factory systems. Rather than relying on simple commodity parts, ON focuses on higher-value analog solutions, depth-sensing technologies, and complex power conversion modules. With established operations spanning the United States, the United Kingdom, Singapore, and Hong Kong, the business maintains a broad international footprint. That geographical reach and exposure to core automation trends set the baseline for their operational performance.

Key Financials
Market Cap
$27.41B
Revenue
$6.20B
EBITDA
$2.09B
Gross Margin
42.8%
Profit Margin
10.2%
Revenue Growth
9.2%
Total Cash
$3.86B
Total Debt
$4.71B
Free Cash Flow
$1.66B


52-Week Price Performance Analysis

Price Statistics
P/E Ratio
47.57
Forward P/E
15.43
Beta
2.05
52-Week High
$134.92
52-Week Low
$44.56
EPS
$1.48
50-Day Avg
$74.81
200-Day Avg
$82.34
Price/Book
3.80
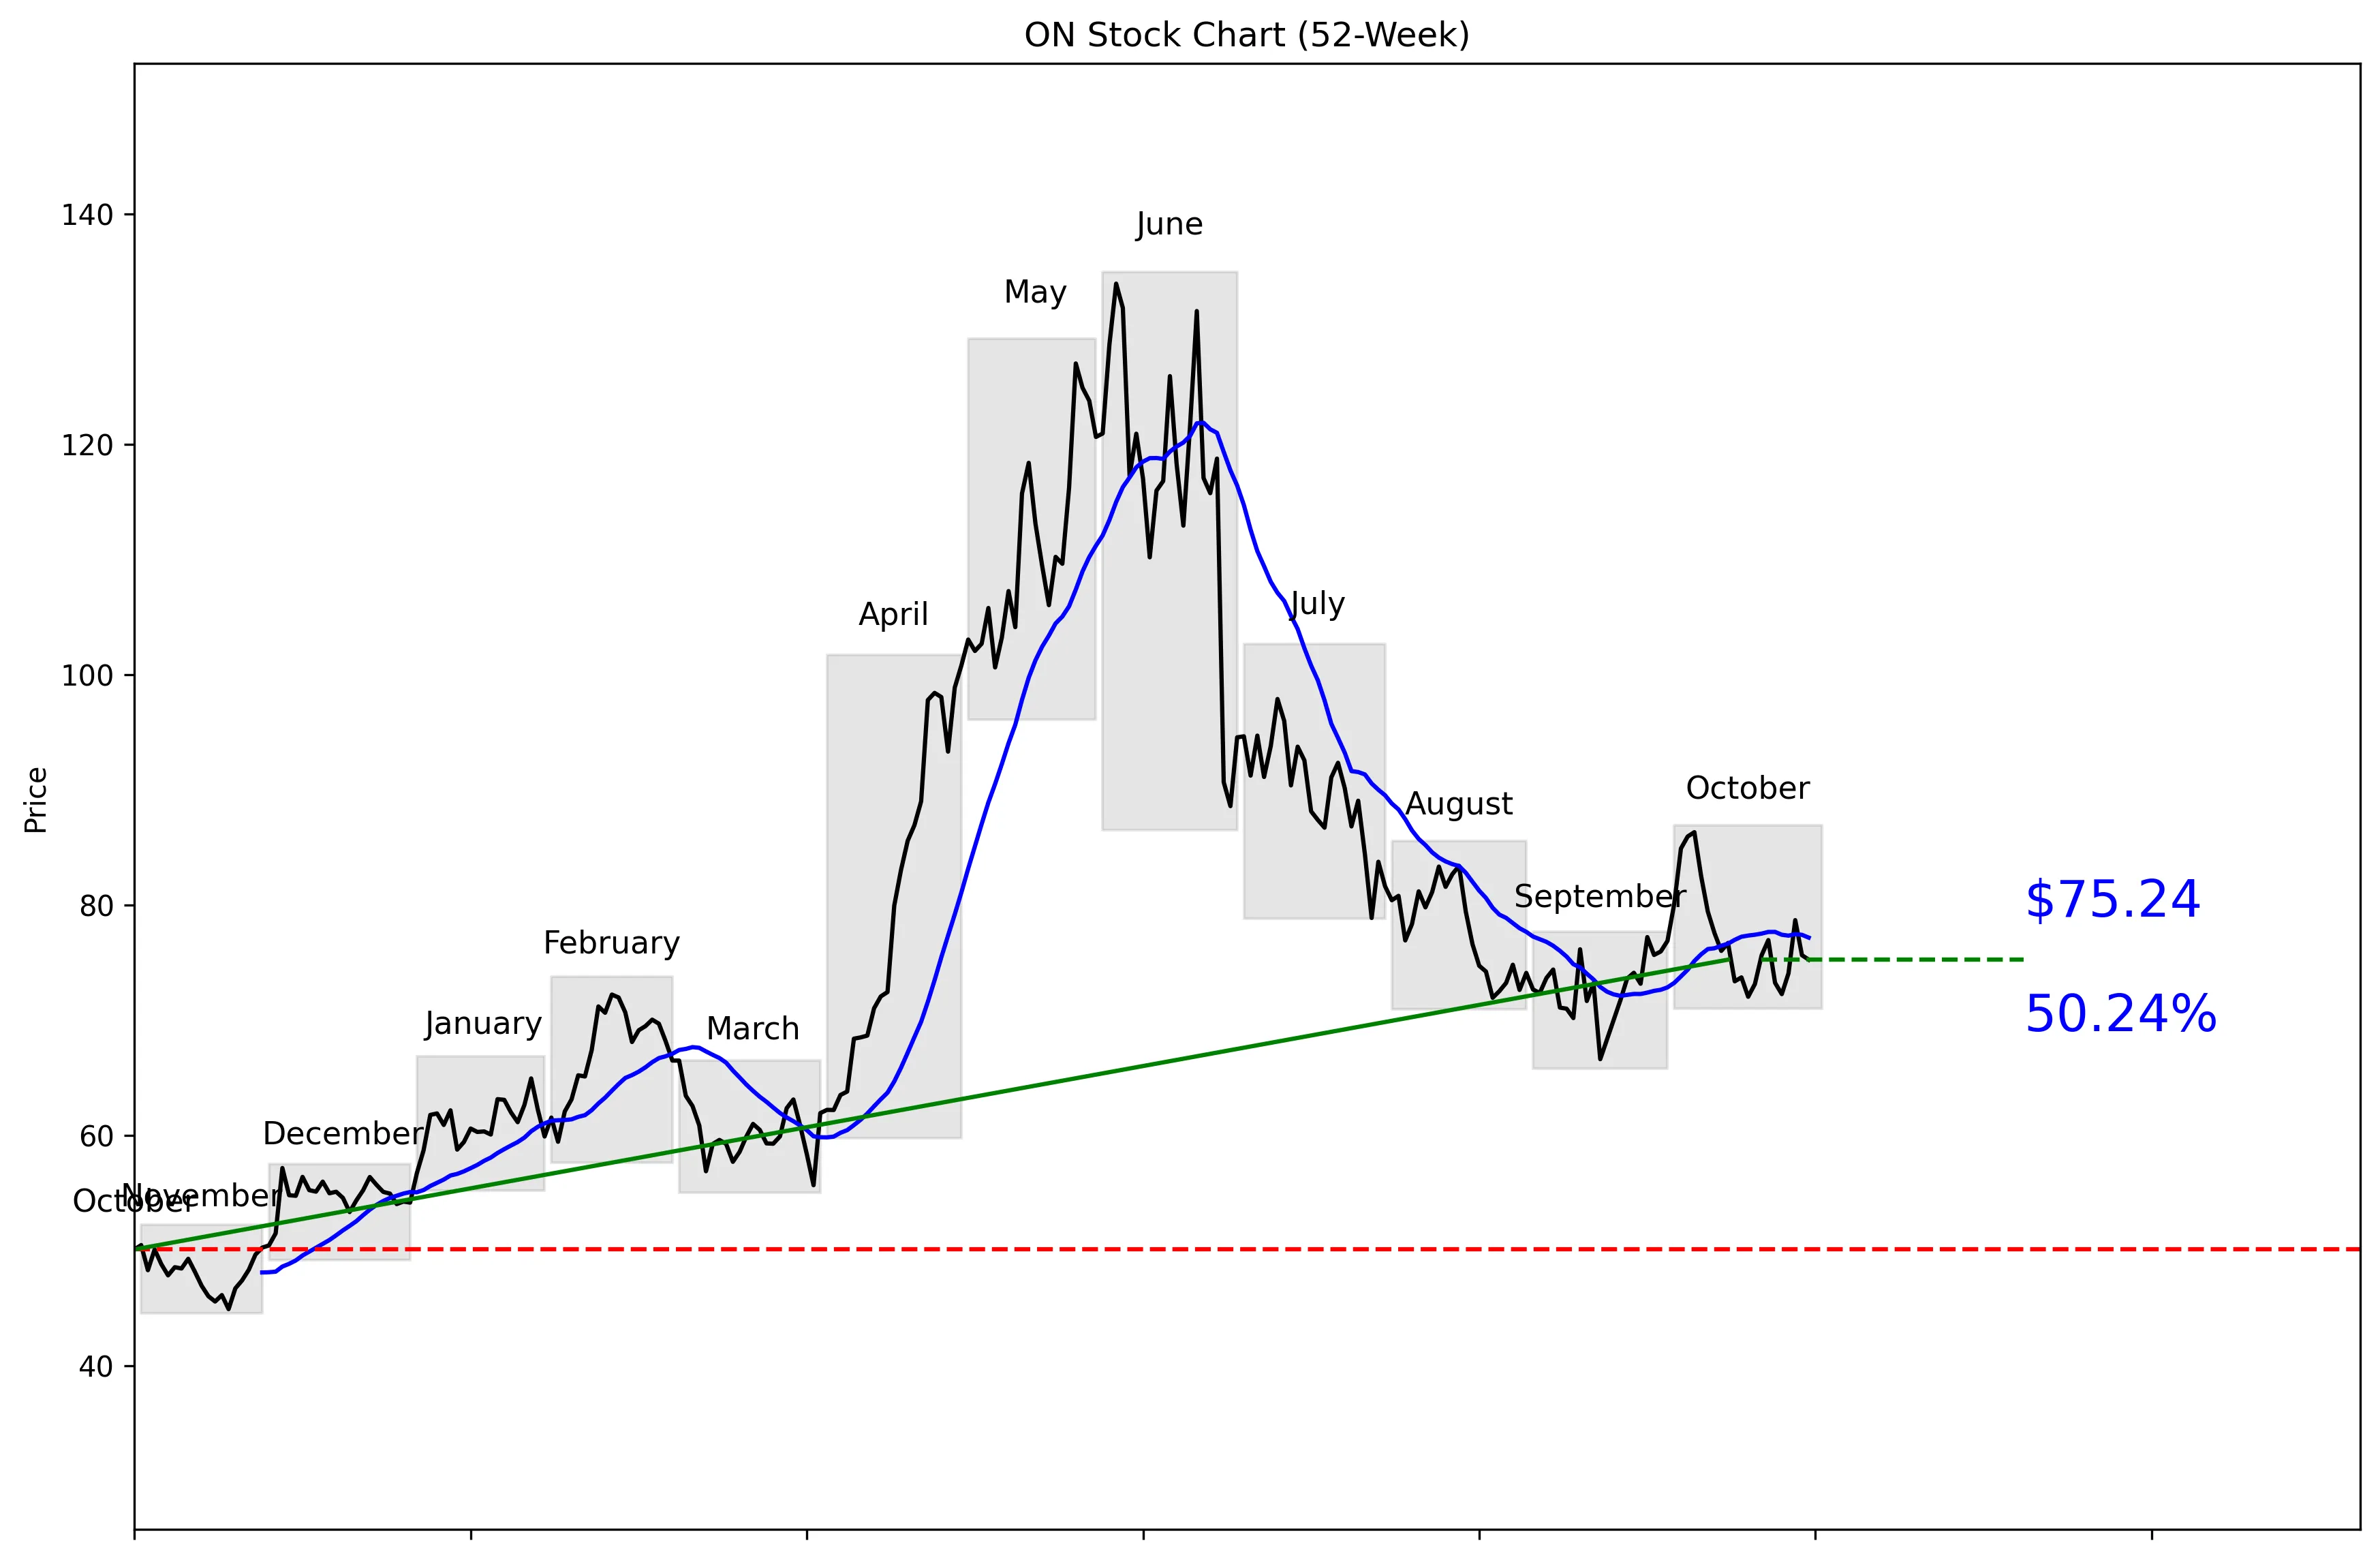
ON 52-Week Stock Chart
Technical Analysis
ON trades at $70.41, just 34% of the way from its $44.56 low to its $134.92 high. The stock is 44.23% below the 52-week high but remains 68.85% above the low. The supplied technical data places the price 2.48% below its $77.16 20-day moving average. Five-day momentum is positive at 2.74%, while 20-day momentum remains negative at 6.04%. Near-term support is $69.98, and resistance is $86.31.


Recent News and Developments

Onsemi weighs nearly $1 billion Ferric acquisition

Onsemi is discussing an acquisition of AI power-management chip startup Ferric for close to $1 billion, according to people familiar with the talks. No agreement has been announced, and the terms could change or collapse. Source: The Information

Q3 earnings become the next major catalyst

Onsemi will report third-quarter results after the market closes on November 2. Analysts expect $0.88 per share, which would represent 39% year-over-year growth, but the actual results are not out yet. Source: 24/7 Wall St.

ON gives back most of its sharp Tuesday rally

ON closed at $74.06 on October 26, jumped to $78.67 on October 27, then fell to $75.63 on October 28 and $75.24 on October 29. The four-session sequence shows heavy volatility heading into earnings, not a clean bullish trend. Source: onsemi


Market Sentiment and Analyst Recommendations

Bull Case
Revenue is $6.20 billion and growing 9.2%, giving ON a measurable growth base. The analyst consensus is buy across 27 analysts. Their average target is $101.63, well above the current $70.41 price, with estimates ranging from $75.00 to $137.00. ON also holds $3.86 billion in cash, which provides financial capacity for strategic investments. The company is discussing a potential acquisition of AI power-management startup Ferric for close to $1 billion, although no agreement has been announced. The clearest reason to buy is the combination of revenue growth, analyst support, and a stock trading 44.23% below its 52-week high.
Bear Case
A P/E ratio of 47.57 is demanding for a company growing revenue by 9.2%. ON carries $4.71 billion in debt against $3.86 billion in cash. The stock is 44.23% below its 52-week high, showing how severely the market has repriced it. Twenty-day momentum is negative at 6.04%, and the price remains below its $77.16 moving average. A potential Ferric acquisition approaching $1 billion would add execution risk, and the talks could still change or collapse. The recent move from $74.06 to $78.67, followed by declines to $75.63 and $75.24, also shows unstable trading ahead of earnings.
What to Watch
Third-quarter results after the close on November 2 are the next major catalyst. Analysts expect earnings of $0.88 per share, representing 39% year-over-year growth, but the actual result is not available yet. Watch whether revenue growth holds near the reported 9.2% rate. The $69.98 support level is critical because the current price of $70.41 sits just above it. A recovery above the $77.16 moving average would improve the technical picture, while $86.31 remains the near-term resistance level. Investors should also monitor whether the Ferric discussions produce a deal and how any transaction near $1 billion would affect ON’s $3.86 billion cash position and $4.71 billion debt load.
Analyst Consensus
BUY

Based on 27 analyst opinions
Low Target
$75.00
Mean Target
$101.63
High Target
$137.00


Earnings and Financial Data

Sector
Technology
Industry
Semiconductors
Employees
22,600
Earnings & Dividends
Next Earnings
Nov 02, 2026
EPS (Trailing)
$1.48
Dividend Yield
None
Payout Ratio
0%

Frequently Asked Questions

Is ON a good stock to buy?
The consensus recommendation is buy based on 27 analysts, and revenue growth is 9.2%. The 47.57 P/E and negative 20-day momentum make the entry less straightforward, so the takeaway is that ON offers upside potential with meaningful valuation and technical risk.
What is ON’s price target?
The average analyst target is $101.63, with estimates ranging from $75.00 to $137.00. The takeaway is that analysts see upside from the current $70.41 price.
What are ON stock’s support and resistance levels?
Near-term support is $69.98, while near-term resistance is $86.31. The takeaway is that ON is trading close to support and needs to clear $86.31 to break above its recent range.
How far is ON stock below its 52-week high?
ON is 44.23% below its $134.92 52-week high and 68.85% above its $44.56 low. The takeaway is that the stock has recovered from its low but remains far from its peak.
Does ON pay a dividend?
The provided data does not include dividend information, so a dividend cannot be confirmed from this dataset. The takeaway is to verify ON’s current dividend policy before making an income-focused investment decision.

Related Stock Reports

Disclaimer: This report is for informational purposes only and does not constitute financial advice. The analysis and opinions expressed are those of AltStation.io and should not be relied upon as the sole basis for investment decisions. Always conduct your own research and consult with a qualified financial advisor before making investment decisions. Past performance does not guarantee future results. Updated October 30, 2026.