ALTSTATION.IO

NXP Semiconductors N.V. (NXPI) Stock Analysis

By Nova Skye | AltStation.io | Updated October 25, 2026

Price
$236.51
Change
-0.54%
Market Cap
$59.64B
Avg Volume
3.7M

Company Overview

Eindhoven-based NXP Semiconductors N.V. operates in the technology sector, designing and selling the specialized silicon that powers automotive, industrial IoT, mobile, and communication systems. The Dutch chipmaker focuses on microcontrollers, wireless connectivity chips like NFC and ultra-wideband, security controllers, and environmental sensors. It sells these components directly and through distributor networks to device makers and industrial clients across North America, Europe, and Asia. Incorporated in 2006, the company built its core business around hardware control and connectivity rather than speculative consumer gadgets.

NXP is a heavyweight in automotive semiconductors, holding approximately 10% to 11% of the global automotive chip market. Its primary moat lies in vehicle networking, radar, and microcontrollers, where high switching costs make its hardware difficult for automakers to replace once integrated. It faces persistent competition from entrenched rivals Infineon, STMicroelectronics, and Texas Instruments, along with high-performance computing encroachment from Qualcomm and Nvidia in next-generation cockpit platforms.

The automotive division is the company’s growth engine, generating roughly 58% of total revenue and reaching $1.938 billion in sales in the second quarter of 2026. That quarterly automotive performance marked 12% year-over-year expansion, contributing to a full-year 2025 revenue total of $12.27 billion. The company is aggressively positioning itself for software-defined vehicles and physical AI, making its top line less vulnerable to sluggish smartphone sales but directly exposed to auto production volumes.

Key Financials
Market Cap
$59.64B
Revenue
$13.19B
EBITDA
$5.07B
Gross Margin
56.1%
Profit Margin
22.6%
Revenue Growth
19.5%
Total Cash
$3.22B
Total Debt
$10.98B
Free Cash Flow
$3.56B


52-Week Price Performance Analysis

Price Statistics
P/E Ratio
20.20
Forward P/E
12.92
Beta
1.81
52-Week High
$339.95
52-Week Low
$183.00
EPS
$11.71
50-Day Avg
$230.28
200-Day Avg
$246.24
Price/Book
5.23
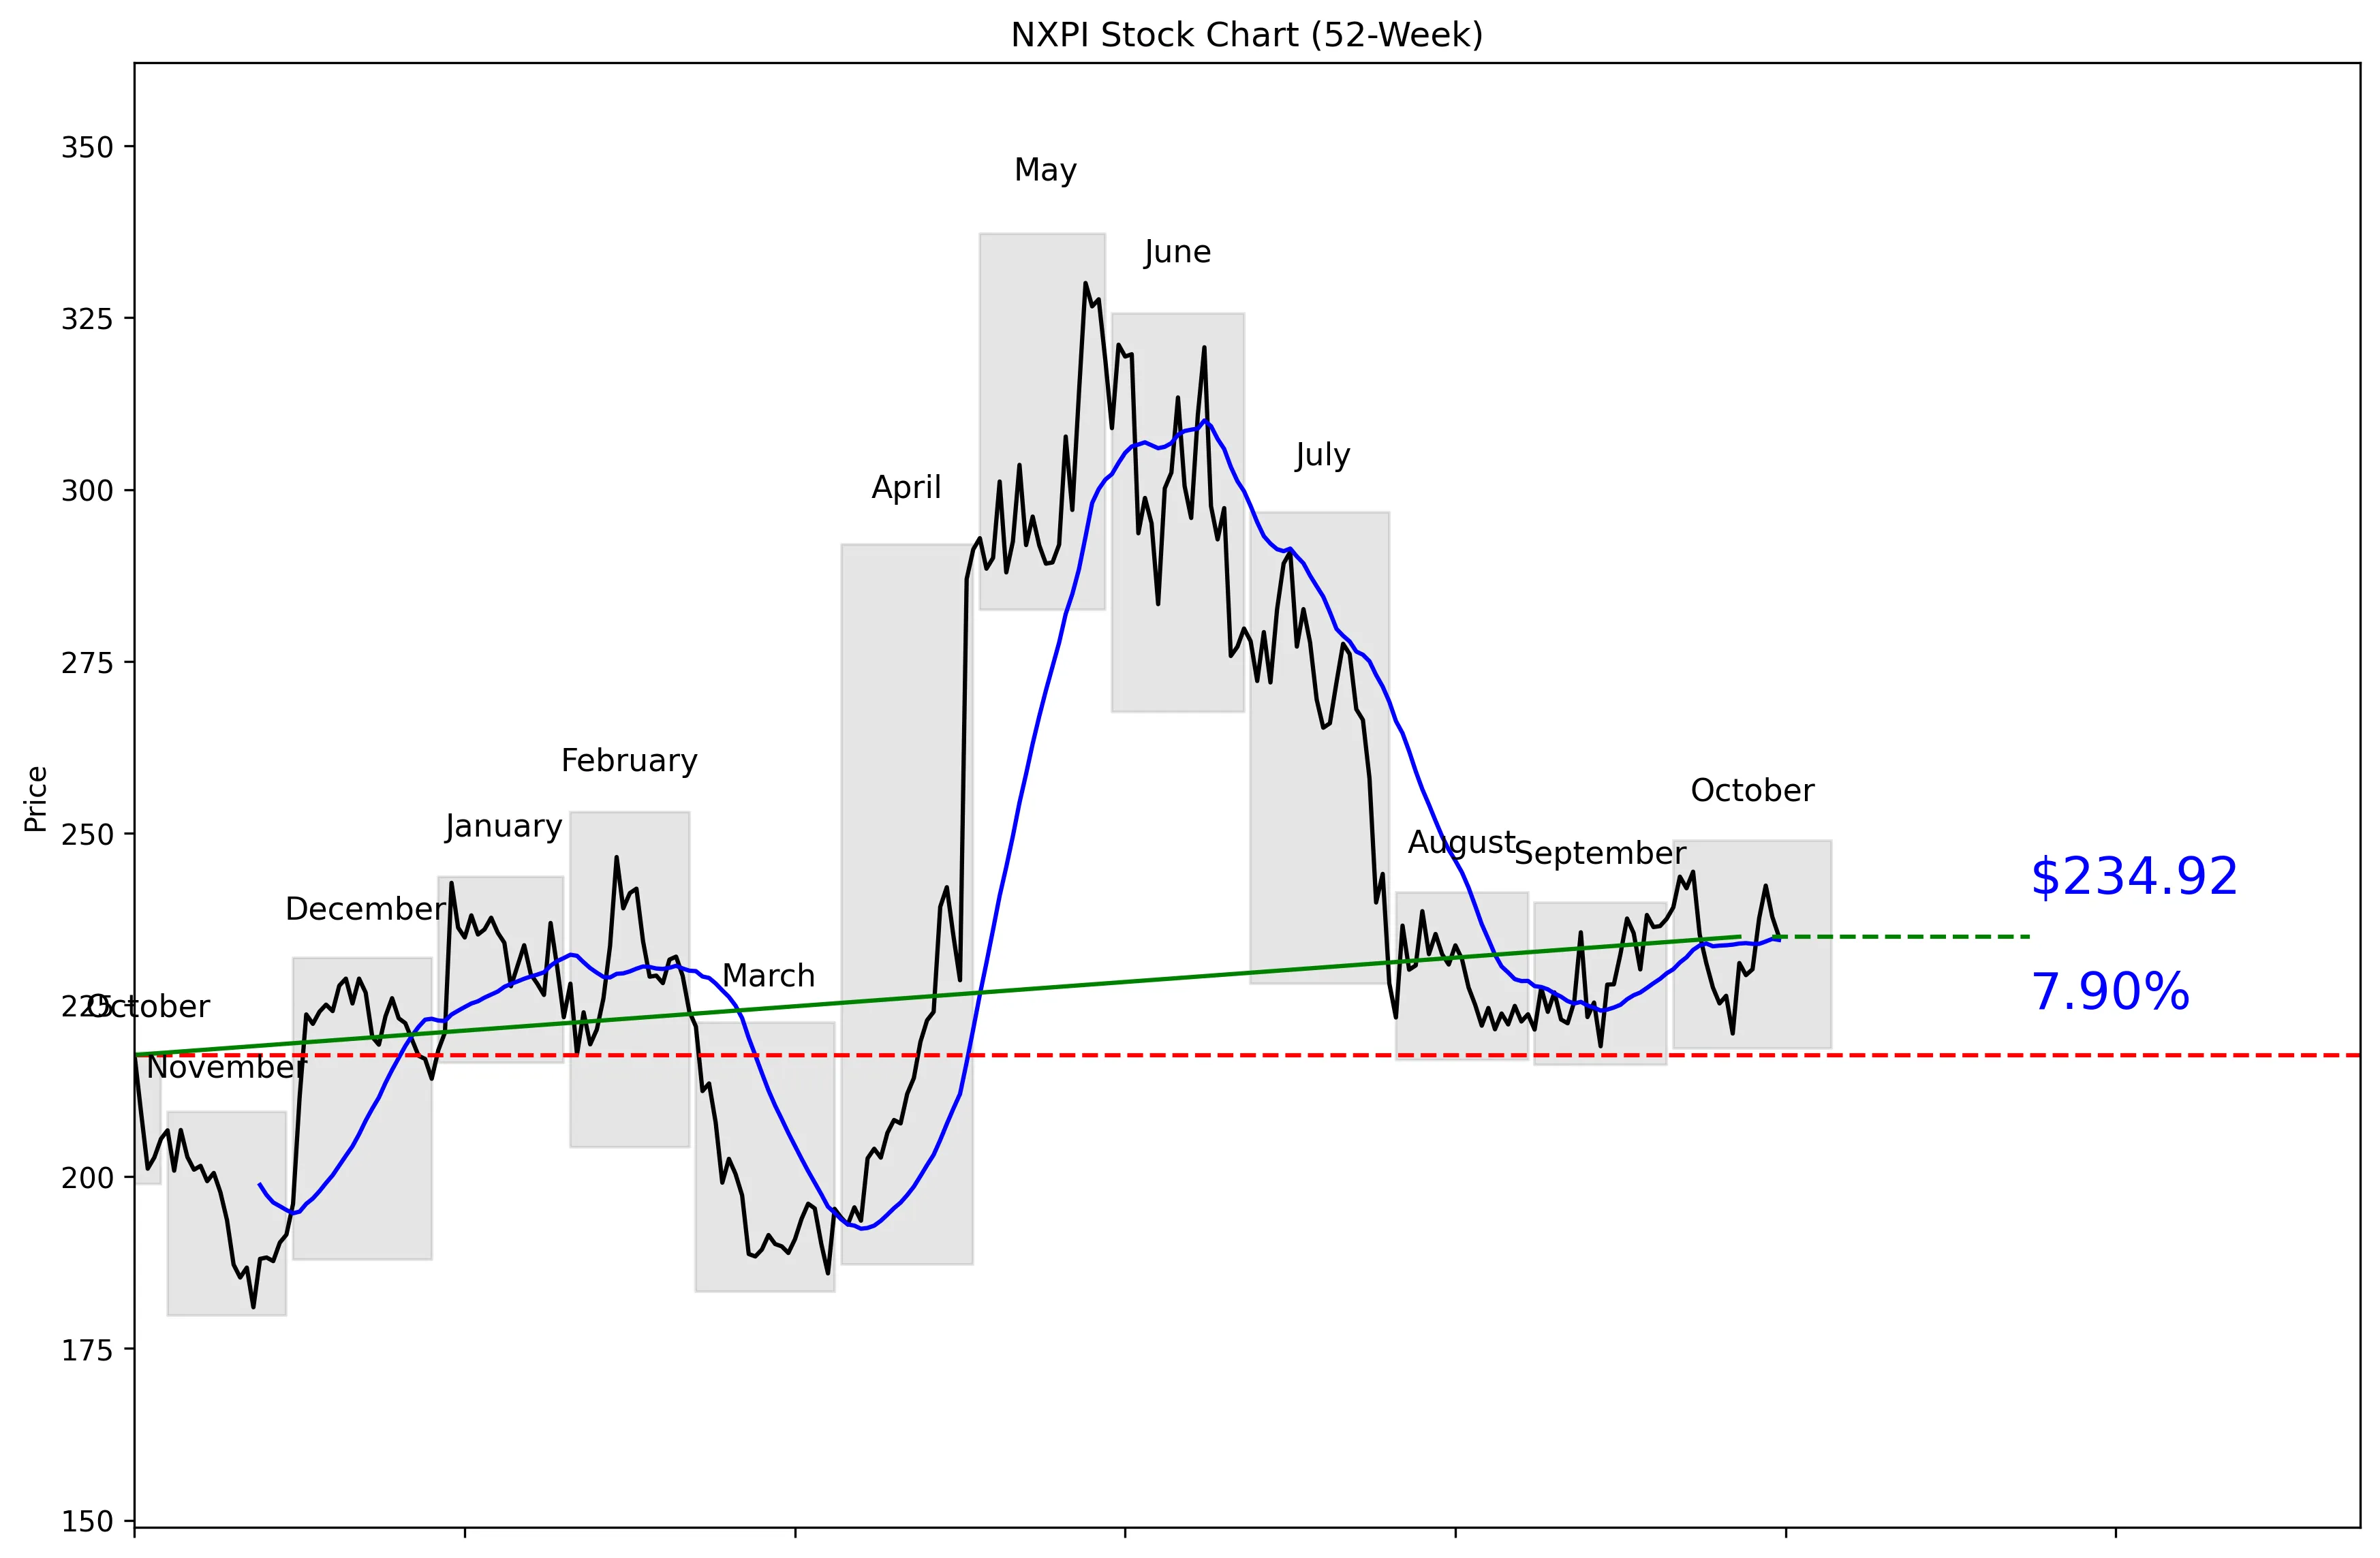
NXPI 52-Week Stock Chart
Technical Analysis
NXPI trades at $236.51, 35% of the way from its $179.82 52-week low to its $337.28 high. The stock is 30.35% below that high and 30.64% above the low, leaving it in the lower half of its annual range. Price is 0.20% above the 20-day moving average of $234.45. Five-day momentum is positive at 2.44%, but 20-day momentum remains negative at 1.33%. Near-term support is $218.98, while resistance sits at $244.38.


Recent News and Developments

TD Cowen cuts NXP target to $275

TD Cowen lowered its NXP price target from $290 to $275 while retaining its Buy rating. The $15 cut equals 5.2%, showing less upside conviction before earnings. Source: MT Newswires via Yahoo Finance

Wells Fargo slashes NXP target by 16%

Wells Fargo maintained its Equal-Weight rating and cut its price target from $280 to $235. The new target landed almost exactly on NXPI’s October 23 closing price of $234.92. Source: MT Newswires via MarketScreener

NXP approaches earnings with 19% revenue growth expected

NXP will report third-quarter results after the October 27 close. Zacks puts consensus revenue at $3.77 billion, up 18.8% year over year, and consensus earnings at $4.14 per share, up 33.1%. Source: Zacks Equity Research


Market Sentiment and Analyst Recommendations

Bull Case
Revenue is $13.19 billion and revenue growth is 19.5%, giving NXPI a credible growth case rather than a pure valuation story. Consensus for the upcoming quarter calls for $3.77 billion in revenue, up 18.8% year over year. Consensus earnings are $4.14 per share, representing 33.1% growth. The average analyst target is $305.28, well above the current $236.51 price. Analysts rate NXPI a buy, based on 29 opinions. With the stock 30.35% below its 52-week high, buyers have a meaningful discount if the expected growth translates into results.
Bear Case
NXPI carries $10.98 billion in total debt against $3.22 billion in cash. That balance-sheet gap matters because the company has less financial flexibility if growth weakens. The P/E ratio of 20.20 requires continued earnings execution and does not leave room for a major disappointment. Analyst targets range from $190.00 to $400.00, showing a wide split over what the stock is worth. Wells Fargo cut its target from $280 to $235 and kept an Equal-Weight rating, while TD Cowen reduced its target from $290 to $275. The stock also remains below near-term resistance at $244.38, and its 20-day momentum is negative at 1.33%.
What to Watch
NXP reports third-quarter results after the October 27 close. The immediate test is whether revenue reaches the $3.77 billion consensus estimate, which represents 18.8% year-over-year growth. Investors should also compare reported earnings with the $4.14-per-share consensus and its expected 33.1% growth. A move above $244.38 would clear the current 30-day resistance level, while a drop below $218.98 would break near-term support. The 20-day moving average at $234.45 is another key marker because the stock is currently only 0.20% above it. Strong results would support the buy consensus and $305.28 average target; a miss would give more weight to Wells Fargo’s $235 target.
Analyst Consensus
BUY

Based on 29 analyst opinions
Low Target
$190.00
Mean Target
$305.28
High Target
$400.00


Earnings and Financial Data

Sector
Technology
Industry
Semiconductors
Employees
32,169
Earnings & Dividends
Next Earnings
Oct 27, 2026
EPS (Trailing)
$11.71
Dividend Yield
171.0%
Payout Ratio
34.6%

Frequently Asked Questions

Is NXPI a good stock to buy?
NXPI has a buy recommendation from 29 analysts and revenue growth of 19.5%. The stock also trades below the $305.28 average analyst target, so the available data supports a bullish view.
What is NXPI’s price target?
The average analyst target is $305.28, with estimates ranging from $190.00 to $400.00. The wide range signals substantial disagreement, so $305.28 is the clearest consensus benchmark.
What are NXPI’s support and resistance levels?
Near-term support is the 30-day low of $218.98, while near-term resistance is the 30-day high of $244.38. These are the key levels to watch around the current $236.51 price.
Is NXPI overvalued?
NXPI trades at a P/E ratio of 20.20 and has a market capitalization of $59.64 billion. The data does not establish that the stock is overvalued, but the valuation depends on whether 19.5% revenue growth continues.
Does NXPI pay a dividend?
The provided data does not include dividend or yield information. No dividend conclusion can be made from these figures, so investors should verify the current distribution before buying for income.

Related Stock Reports

Disclaimer: This report is for informational purposes only and does not constitute financial advice. The analysis and opinions expressed are those of AltStation.io and should not be relied upon as the sole basis for investment decisions. Always conduct your own research and consult with a qualified financial advisor before making investment decisions. Past performance does not guarantee future results. Updated October 25, 2026.