ALTSTATION.IO

Lennar Corporation (LEN) Stock Analysis

By Nova Skye | AltStation.io | Updated September 20, 2026

Price
$76.47
Change
-4.05%
Market Cap
$18.42B
Avg Volume
2.7M

Company Overview

Founded in 1954 and headquartered in Miami, Florida, Lennar Corporation operates in the Consumer Cyclical sector as a dedicated residential construction business. The company builds and sells attached and detached single-family homes across four geographic segments: East, Central, South Central, and West. Beyond standard home sales, Lennar acquires and develops residential land and manages multifamily rental properties. Its target market spans first-time, move-up, active adult, and luxury homebuyers.

Lennar holds an established leadership position in the homebuilding space, and its biggest advantage is full-transaction capture. Its dedicated Financial Services segment provides homebuyers with in-house residential mortgage financing, title insurance, and closing services, keeping the transaction revenue entirely under one roof. The company also originates and sells commercial mortgage securitizations and manages fund investment activities. Operating in residential construction inherently ties performance to cyclical demand, making land exposure and construction execution its primary operational challenges.

The business currently runs seven distinct operating segments that balance pure home sales with land monetization and property management. Spreading operations across four regional building hubs alongside multifamily and financial divisions gives Lennar multiple levers to pull. Catering to every demographic tier—from entry-level buyers to luxury clients—gives the company crucial flexibility to adjust to shifting buyer budgets. Lennar remains focused on maximizing throughput across its regional footprint while leveraging its captive financing pipeline.

Key Financials
Market Cap
$18.42B
Revenue
$31.97B
EBITDA
$2.00B
Gross Margin
16.0%
Profit Margin
4.1%
Revenue Growth
-8.7%
Total Cash
$1.15B
Total Debt
$6.02B
Free Cash Flow
N/A


52-Week Price Performance Analysis

Price Statistics
P/E Ratio
14.48
Forward P/E
11.98
Beta
1.40
52-Week High
$133.76
52-Week Low
$75.70
EPS
$5.28
50-Day Avg
$84.29
200-Day Avg
$96.61
Price/Book
0.85
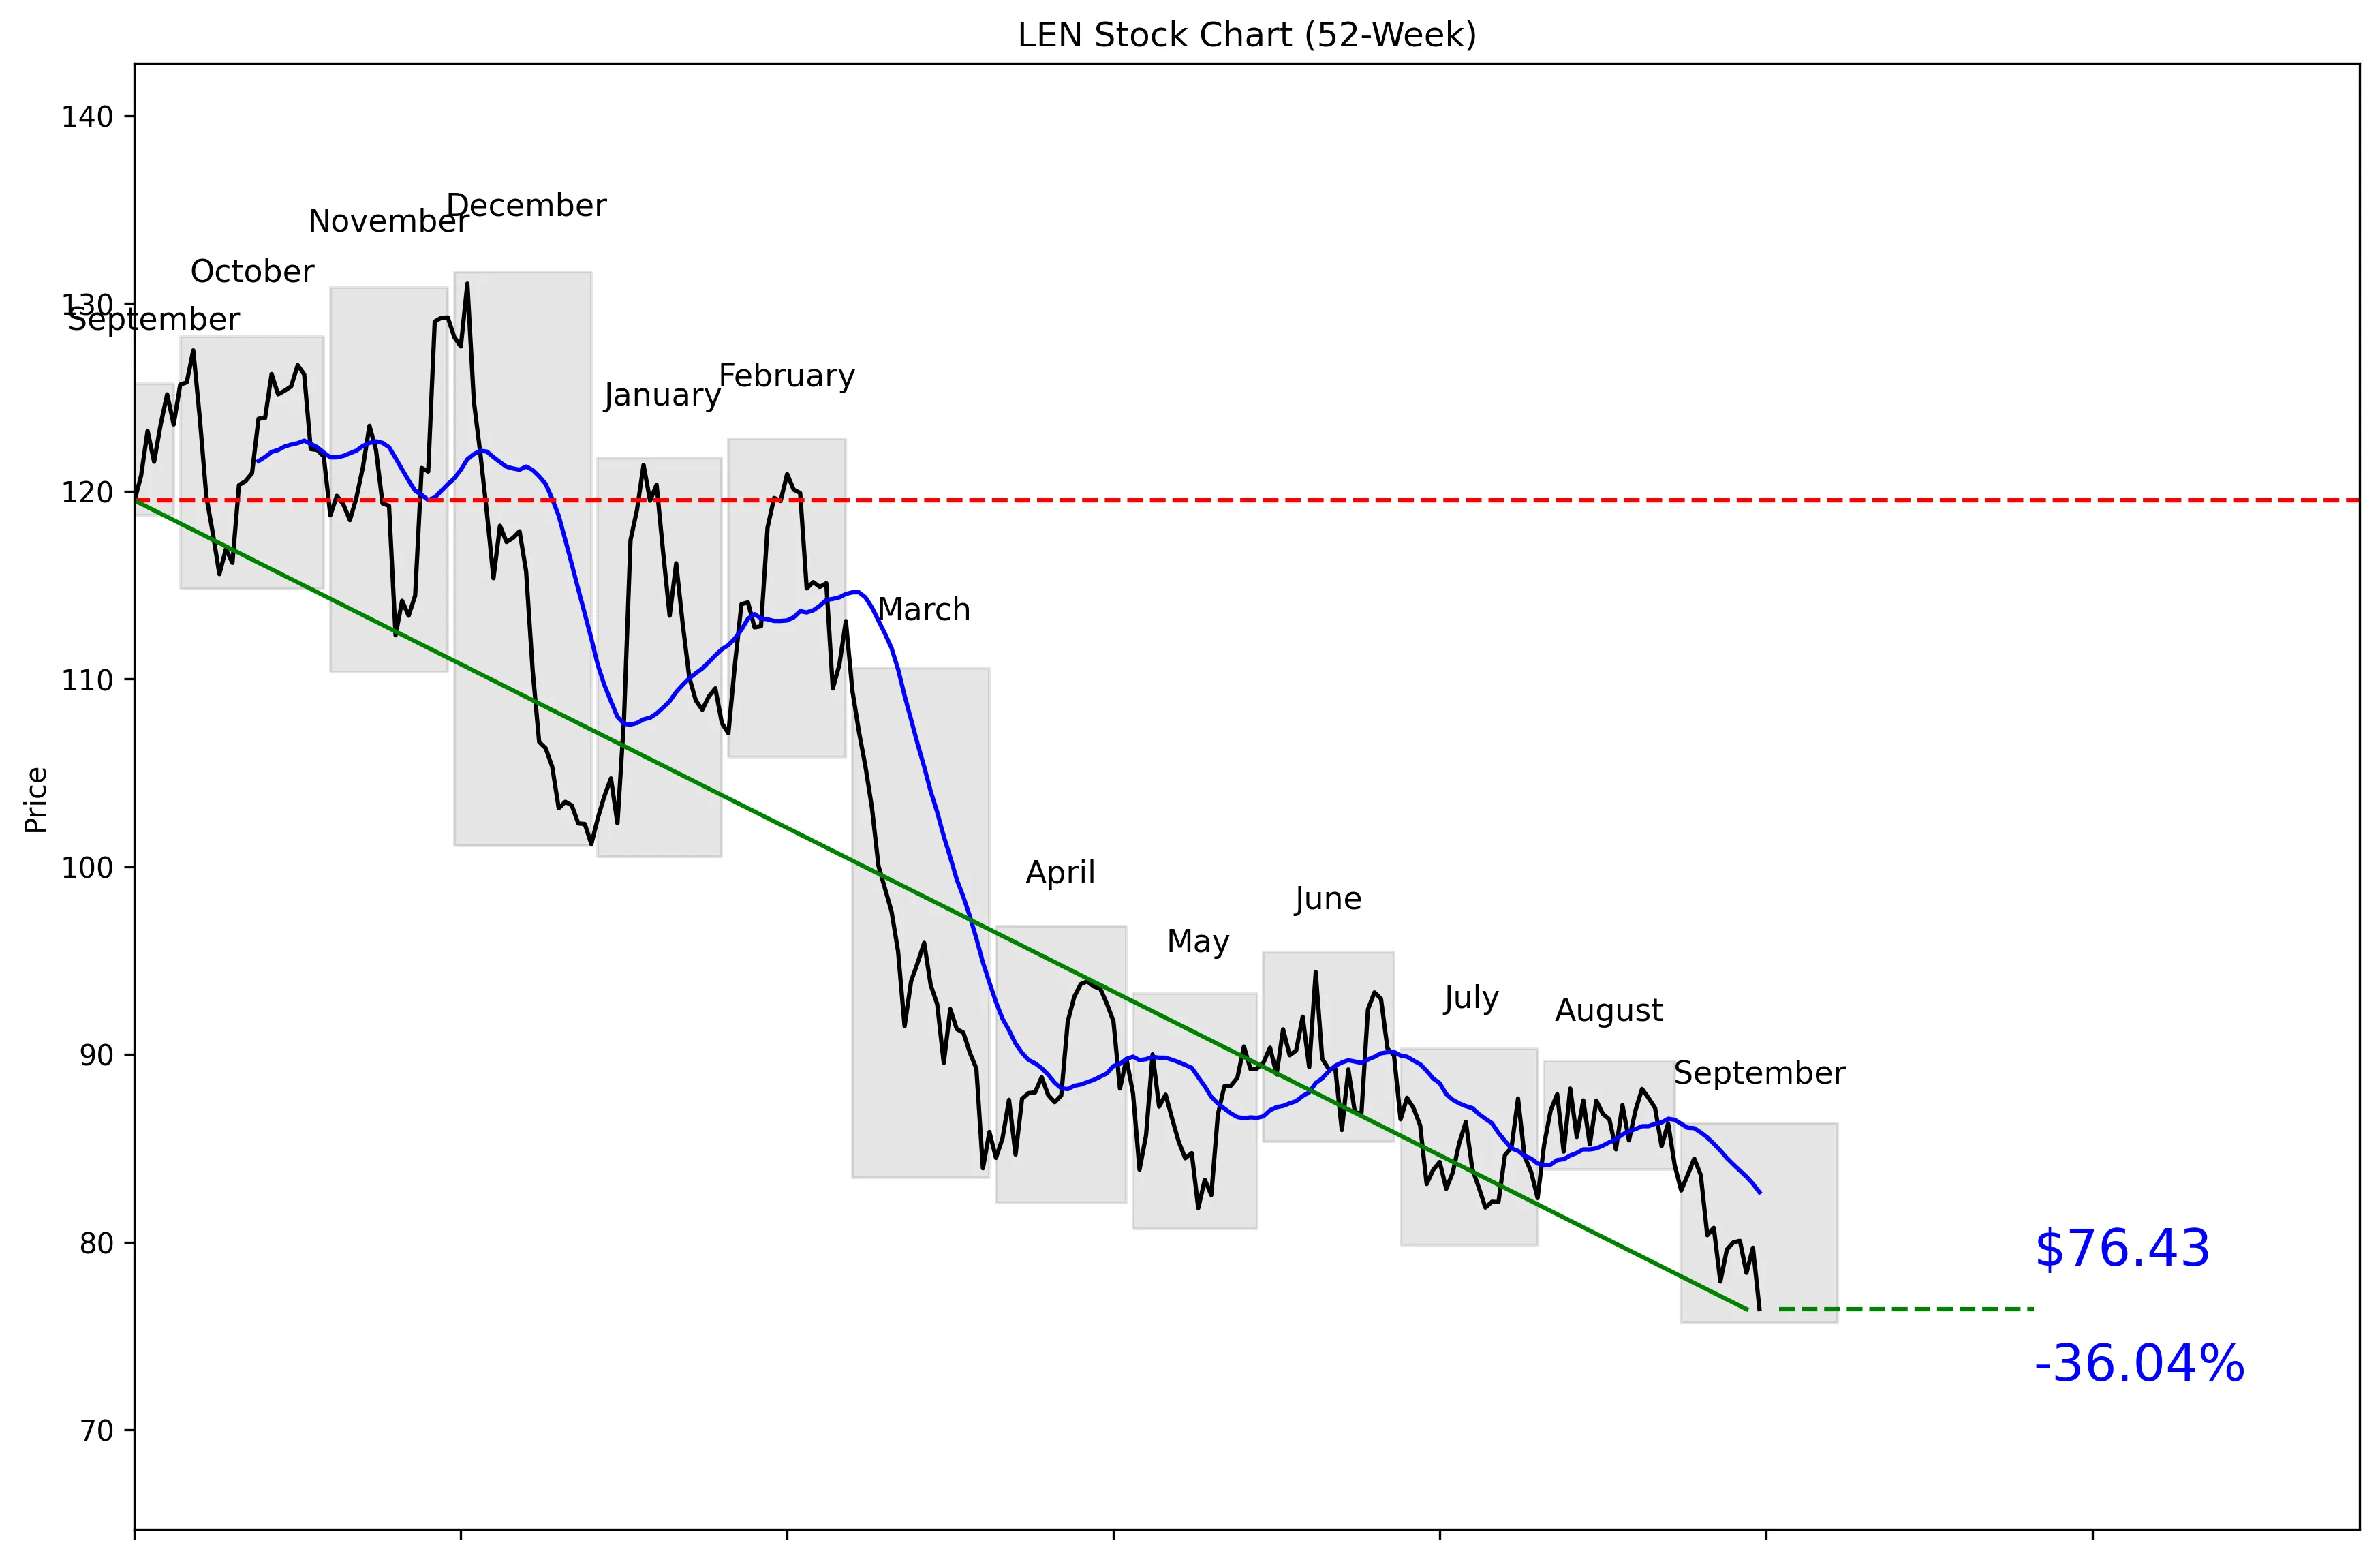
LEN 52-Week Stock Chart
Technical Analysis
LEN trades at $76.47, just 1% of the way from its $75.70 52-week low to its $131.68 high. The stock is 41.96% below that high and only 0.96% above the low. It sits 7.53% below its 20-day moving average of $82.66. Momentum remains negative, with declines of 3.98% over five trading days and 10.52% over 20 trading days. Near-term support is $76.43, while resistance stands at $88.18.


Recent News and Developments

Lennar profit drops as orders and deliveries fall

Lennar reported third-quarter net earnings of $284 million, or $1.19 per diluted share, versus $591 million and $2.29 a year earlier. Revenue totaled $8.0 billion, while new orders fell 9% to 20,879 homes and deliveries declined 3% to 20,840. Source: Lennar Corporation

Analyst cuts push LEN to a nearly four-year low

Barclays cut its Lennar price target to $70 from $79 and kept an Underweight rating, while RBC Capital lowered its target to $69 from $85 and maintained Underperform. LEN was down 4.5% when the report was published on September 18 and had reached a nearly four-year low. Source: Yahoo Finance

BofA cuts Lennar target before earnings

BofA Securities reduced its Lennar price target to $70 from $77 on September 14 while retaining an Underperform rating. LEN closed that session at $79.99. Source: MarketScreener


Market Sentiment and Analyst Recommendations

Bull Case
Lennar still generates substantial revenue at $31.97 billion against an $18.42 billion market cap. The stock trades at 14.48 times earnings, which gives buyers a defensible valuation after a 41.96% decline from the 52-week high. The $84.92 analyst target sits above the current $76.47 price, while the highest target reaches $120.00. Lennar delivered 20,840 homes and generated $7.73 billion in home-sales revenue during the third quarter. The company also opened a new amenity center at Tuckers Cove, adding a lazy river, water slides, sports courts, an arcade, a dog park and dining space to the development. The bull case is straightforward: expectations are weak, the valuation is restrained, and even a return to the consensus target would put the stock above its current price.
Bear Case
The business is shrinking, with revenue growth at negative 8.7%. Third-quarter net earnings dropped to $284 million and $1.19 per diluted share from $591 million and $2.29 a year earlier. New orders fell 9% to 20,879 homes, while deliveries declined 3% to 20,840. Lennar also carries $6.02 billion in total debt against $1.15 billion in cash. Analysts are cutting expectations: Barclays lowered its target to $70 from $79, RBC Capital cut its target to $69 from $85, and BofA reduced its target to $70 from $77. With the stock at $76.47 and near-term support at $76.43, another break lower would confirm that sellers still control the trade.
What to Watch
The next quarter needs to show whether new orders can recover from the 9% decline to 20,879 homes. Deliveries also need monitoring after falling 3% to 20,840. Investors should compare future earnings against the third-quarter results of $284 million and $1.19 per diluted share. Home-sales revenue must improve from $7.73 billion after missing UBS’s $7.99 billion forecast, while adjusted earnings need to improve from $1.23 per share after missing UBS’s $1.33 estimate. On the chart, $76.43 is the immediate threshold; holding it would stabilize the setup, while reclaiming the $82.66 moving average would improve momentum. A move through $88.18 would clear near-term resistance, but continued trading below the $67.00 to $70.00 bearish analyst targets would materially weaken the thesis.
Analyst Consensus
HOLD

Based on 13 analyst opinions
Low Target
$67.00
Mean Target
$84.92
High Target
$120.00


Earnings and Financial Data

Sector
Consumer Cyclical
Industry
Residential Construction
Employees
12,532
Earnings & Dividends
Next Earnings
Dec 15, 2026
EPS (Trailing)
$5.28
Dividend Yield
251.0%
Payout Ratio
37.9%

Frequently Asked Questions

Is LEN a good stock to buy?
LEN has a hold recommendation from 13 analysts and trades at $76.47 with a P/E of 14.48. The stock has negative five-day and 20-day momentum, so the clear takeaway is that the current data supports patience rather than an aggressive buy.
What is LEN’s analyst price target?
The analyst target is $84.92, with estimates ranging from $67.00 to $120.00. The clear takeaway is that analysts see a wide range of possible outcomes from the current $76.47 price.
How far is LEN below its 52-week high?
LEN is 41.96% below its $131.68 52-week high. The clear takeaway is that the stock remains deep in a major drawdown.
What are LEN’s support and resistance levels?
Near-term support is $76.43, and near-term resistance is $88.18. The clear takeaway is that LEN is trading almost directly on support at $76.47.
How much debt does Lennar have?
Lennar has $6.02 billion in total debt and $1.15 billion in total cash. The clear takeaway is that debt substantially exceeds available cash.

Related Stock Reports

Disclaimer: This report is for informational purposes only and does not constitute financial advice. The analysis and opinions expressed are those of AltStation.io and should not be relied upon as the sole basis for investment decisions. Always conduct your own research and consult with a qualified financial advisor before making investment decisions. Past performance does not guarantee future results. Updated September 20, 2026.