ALTSTATION.IO

PulteGroup, Inc. (PHM) Stock Analysis

By Nova Skye | AltStation.io | Updated October 17, 2026

Price
$113.06
Change
+0.06%
Market Cap
$21.54B
Avg Volume
1.7M

Company Overview

Headquartered in Atlanta, United States, and founded in 1950, PulteGroup, Inc. builds and sells homes in the residential construction industry within the consumer cyclical sector. The company develops land to construct single-family detached houses as well as townhomes, condominiums, and duplexes. It sells across three distinct buyer categories: first-time buyers through its Centex brand (roughly 38% of business), move-up buyers via Pulte Homes and John Wieland (around 40%), and active-adult retirees through Del Webb and DiVosta (about 22%). PulteGroup also operates in-house mortgage banking, title, and insurance businesses to capture financing revenue directly at the closing table.

PulteGroup is an established market leader, consistently ranking as one of the top three largest homebuilders in the nation behind D.R. Horton and Lennar. Its edge comes from geographic scale across more than 45 markets in over 25 states and a premier brand in Del Webb that dominates the less rate-sensitive active-adult cohort. The biggest threat to its momentum is housing affordability, where steep mortgage rates squeeze entry-level buyers and intensify pricing competition against rivals like D.R. Horton. Still, its multi-brand setup gives it better customer diversification than single-niche builders.

PulteGroup is growing and executing with strong operational efficiency rather than pulling back. For the full year 2024, the company closed 31,219 homes, pulling in $17.3 billion in home sale revenue, $3.1 billion in net income, and $14.69 in diluted earnings per share. Home sale gross margins held firm between 27.5% and 28.8% in the second half of 2024, showing that pricing discipline stayed intact despite macro volatility. PulteGroup is using that cash flow to prioritize land options and share repurchases, keeping its balance sheet cleaner and far more resilient than in previous housing downturns.

Key Financials
Market Cap
$21.54B
Revenue
$16.41B
EBITDA
$2.75B
Gross Margin
25.6%
Profit Margin
11.6%
Revenue Growth
-9.6%
Total Cash
$1.34B
Total Debt
$2.48B
Free Cash Flow
$1.08B


52-Week Price Performance Analysis

Price Statistics
P/E Ratio
11.54
Forward P/E
10.43
Beta
1.16
52-Week High
$144.50
52-Week Low
$107.16
EPS
$9.80
50-Day Avg
$121.74
200-Day Avg
$124.33
Price/Book
1.63
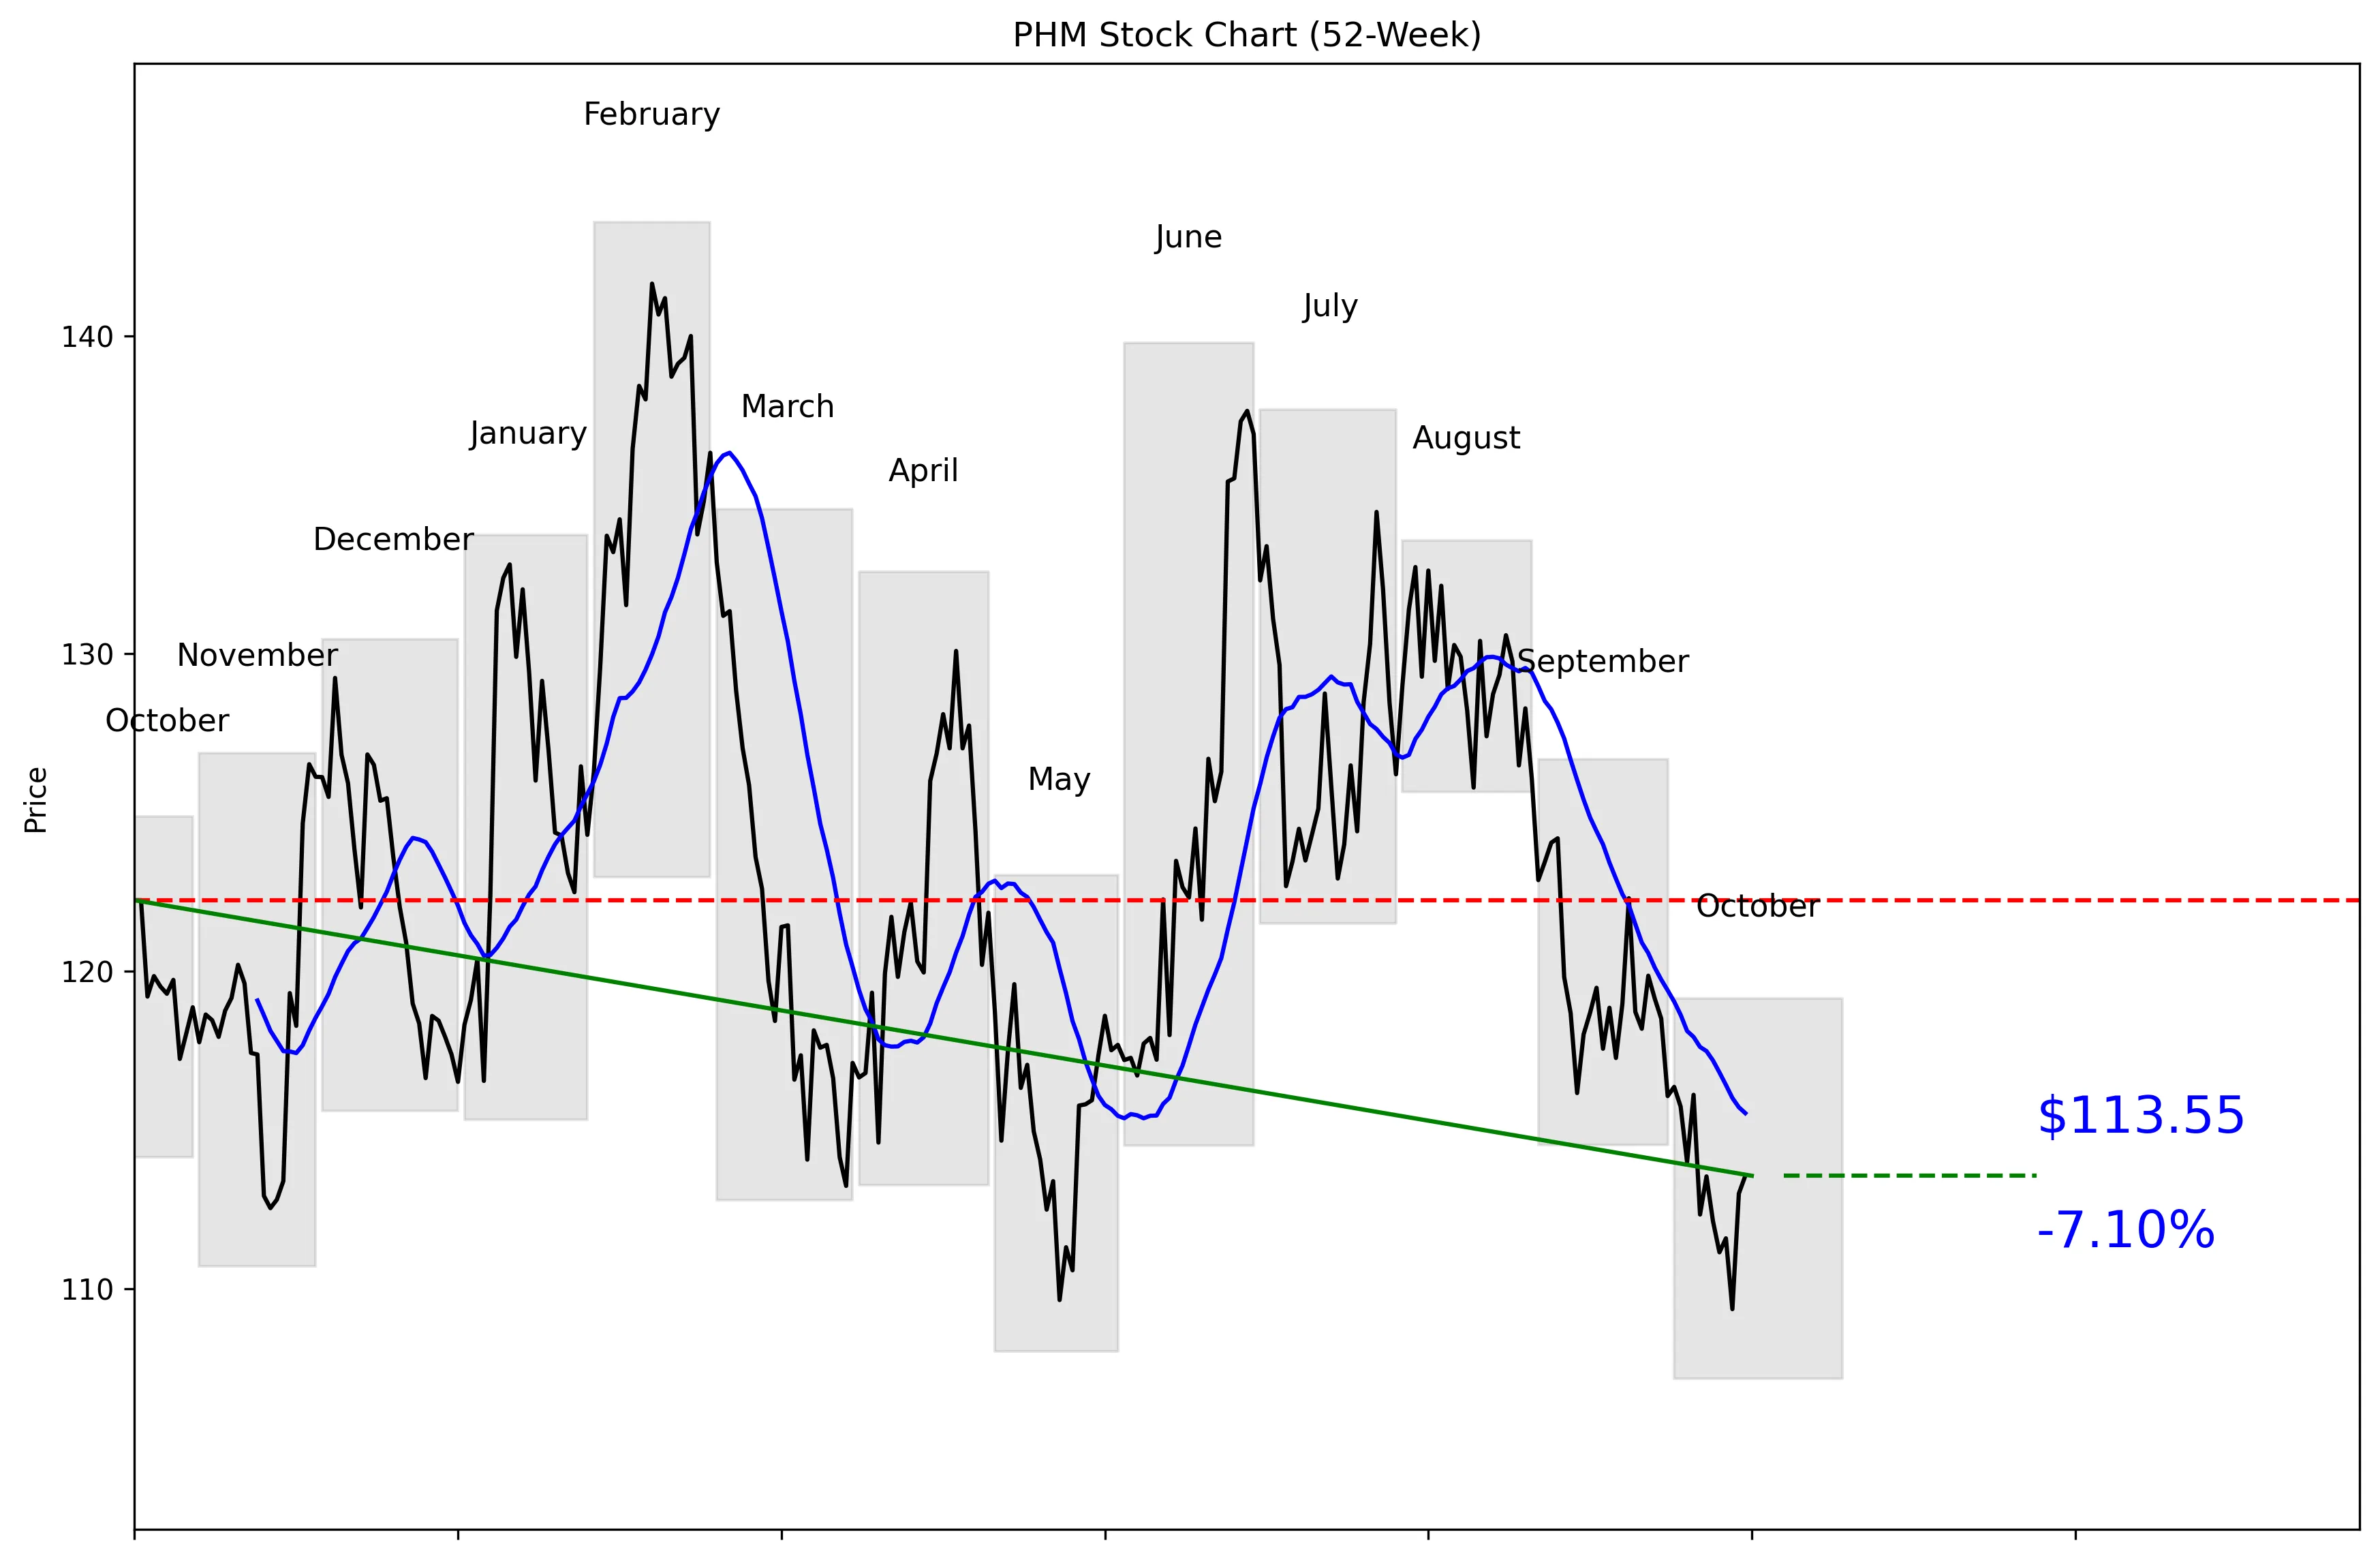
PHM 52-Week Stock Chart
Technical Analysis
PHM trades at $113.06, just 18% of the way from its $107.16 52-week low to its $143.57 high. The stock is 20.91% below that high but only 5.96% above the low, putting it near the weak end of its annual range. It sits 1.71% below the 20-day moving average of $115.52. Momentum improved 1.28% over the last five trading days, but the 20-day reading remains negative at 3.16%. Near-term support is $109.35, while resistance is $124.18.


Recent News and Developments

Citi cuts PulteGroup target to $122

Citi lowered its PHM price target from $134 to $122 on October 15 while keeping a Neutral rating. The firm expects another decline in construction activity during October. Source: The Fly

RBC cuts PulteGroup target below the share price

RBC Capital lowered its PHM target from $116 to $111 on October 15 and maintained its Sector Perform rating. The $111 target was below the stock’s $112.99 closing price that day. Source: AD HOC NEWS

Goldman Sachs trims PulteGroup target

Goldman Sachs lowered its PHM price target from $146 to $138 on October 12. The firm reiterated its Hold rating. Source: TipRanks


Market Sentiment and Analyst Recommendations

Bull Case
PHM’s $11.54 P/E is the clearest reason to consider buying the stock. The shares trade at $113.06, while the consensus analyst target is $136.41. The most optimistic analyst target is $166.00, showing meaningful upside if operating results stabilize. Wall Street’s overall recommendation is buy based on 17 analysts. PulteGroup also has $1.34 billion in cash against $2.48 billion in debt, giving it liquidity despite the softer operating environment. The bullish argument is simple: expectations are already low, the valuation is modest, and a recovery toward the analyst consensus would produce substantial upside.
Bear Case
Revenue is shrinking, with reported growth at negative 9.6%. Wall Street expects third-quarter revenue of $4.13 billion, down 6.2%, and earnings of $2.62 per share, down 11.5%. Citi expects another decline in construction activity during October and cut its target from $134 to $122. RBC reduced its target from $116 to $111, below the current $113.06 share price. Goldman Sachs also lowered its target from $146 to $138 and maintained a Hold rating. PHM may look inexpensive at 11.54 times earnings, but falling revenue and earnings can make a low multiple a warning rather than an opportunity.
What to Watch
PulteGroup is scheduled to report third-quarter results on October 22. The immediate benchmarks are earnings of $2.62 per share and revenue of $4.13 billion. Results above those levels would challenge the current weak expectations, while misses would reinforce the negative revenue trend. Investors should watch whether PHM holds the $109.35 near-term support level and its $107.16 52-week low. A move above the $115.52 20-day moving average would improve the technical picture, while $124.18 remains the next listed resistance level. Analyst revisions also matter because recent targets range from RBC’s $111 to Goldman Sachs’ $138, with Citi positioned at $122.
Analyst Consensus
BUY

Based on 17 analyst opinions
Low Target
$100.00
Mean Target
$136.41
High Target
$166.00


Earnings and Financial Data

Sector
Consumer Cyclical
Industry
Residential Construction
Employees
6,506
Earnings & Dividends
Next Earnings
Oct 22, 2026
EPS (Trailing)
$9.80
Dividend Yield
92.0%
Payout Ratio
10.2%

Frequently Asked Questions

Is PHM a good stock to buy?
PHM has a buy recommendation from 17 analysts and trades at a P/E of 11.54. The takeaway is that analysts are positive overall, but revenue growth is negative 9.6%.
What is PHM’s price target?
The analyst target is $136.41, with estimates ranging from $100.00 to $166.00. The takeaway is that the consensus target sits above the current $113.06 price, but the range shows substantial disagreement.
What are PHM’s support and resistance levels?
Near-term support is $109.35, and near-term resistance is $124.18. The takeaway is that these are the key 30-day levels to watch around the current $113.06 price.
Where is PHM trading within its 52-week range?
PHM is 18% of the way from its $107.16 52-week low to its $143.57 high. The takeaway is that the stock remains much closer to its low than its high.
Does PHM pay a dividend?
The supplied data does not include dividend information. The takeaway is that no dividend conclusion can be made from the available figures.

Related Stock Reports

Disclaimer: This report is for informational purposes only and does not constitute financial advice. The analysis and opinions expressed are those of AltStation.io and should not be relied upon as the sole basis for investment decisions. Always conduct your own research and consult with a qualified financial advisor before making investment decisions. Past performance does not guarantee future results. Updated October 17, 2026.