ALTSTATION.IO

The Mosaic Company (MOS) Stock Analysis

By Nova Skye | AltStation.io | Updated October 22, 2026

Price
$17.70
Change
-0.92%
Market Cap
$5.63B
Avg Volume
8.5M

Company Overview

Headquartered in Tampa, Florida, The Mosaic Company operates in the Basic Materials sector within the Agricultural Inputs industry. The company mines, processes, and markets concentrated phosphate and potash crop nutrients across 3 distinct operating segments: Phosphates, Potash, and Mosaic Fertilizantes. Its product catalog spans bulk crop nutrients like diammonium phosphate, specialty crop blends such as MicroEssentials and K-Mag, and phosphate-based animal feed ingredients under the Biofos and Nexfos brands. Mosaic sells these products directly to wholesale distributors, retail chains, agricultural cooperatives, and industrial buyers across the United States, Brazil, Canada, and 12 other international markets.

Mosaic holds a major market position in the fertilizer space rather than acting as a niche player, backed by extensive vertical integration. Its primary competitive advantage stems from owning critical production and logistics infrastructure, which includes active mines, chemical processing plants, blending facilities, and dedicated port terminals. The main threat to the business is its direct exposure to global commodity cycles, raw material cost inflation, and fluctuating farm economics. While managing 3 separate divisions provides some geographic and product diversification, revenue remains tightly bound to international nutrient demand and bulk fertilizer pricing.

Incorporated in 1987, Mosaic has built a mature global footprint across North America, South America, and Asia, anchored heavily by its domestic mining assets and its Mosaic Fertilizantes footprint in Brazil. The company is not undergoing a radical business pivot; it is focused on maintaining high asset utilization at its mines and driving sales of higher-margin, value-added products like MicroEssentials. Production efficiency, international export access, and cost control across its supply chain drive current performance. Mosaic remains a direct, cyclical play on global agriculture where operational discipline dictates bottom-line results.

Key Financials
Market Cap
$5.63B
Revenue
$12.25B
EBITDA
$1.72B
Gross Margin
11.2%
Profit Margin
-5.2%
Revenue Growth
-6.0%
Total Cash
$294.00M
Total Debt
$6.08B
Free Cash Flow
-$746.28M


52-Week Price Performance Analysis

Price Statistics
P/E Ratio
N/A
Forward P/E
11.43
Beta
0.92
52-Week High
$32.25
52-Week Low
$17.59
EPS
$-2.01
50-Day Avg
$22.72
200-Day Avg
$24.20
Price/Book
0.49
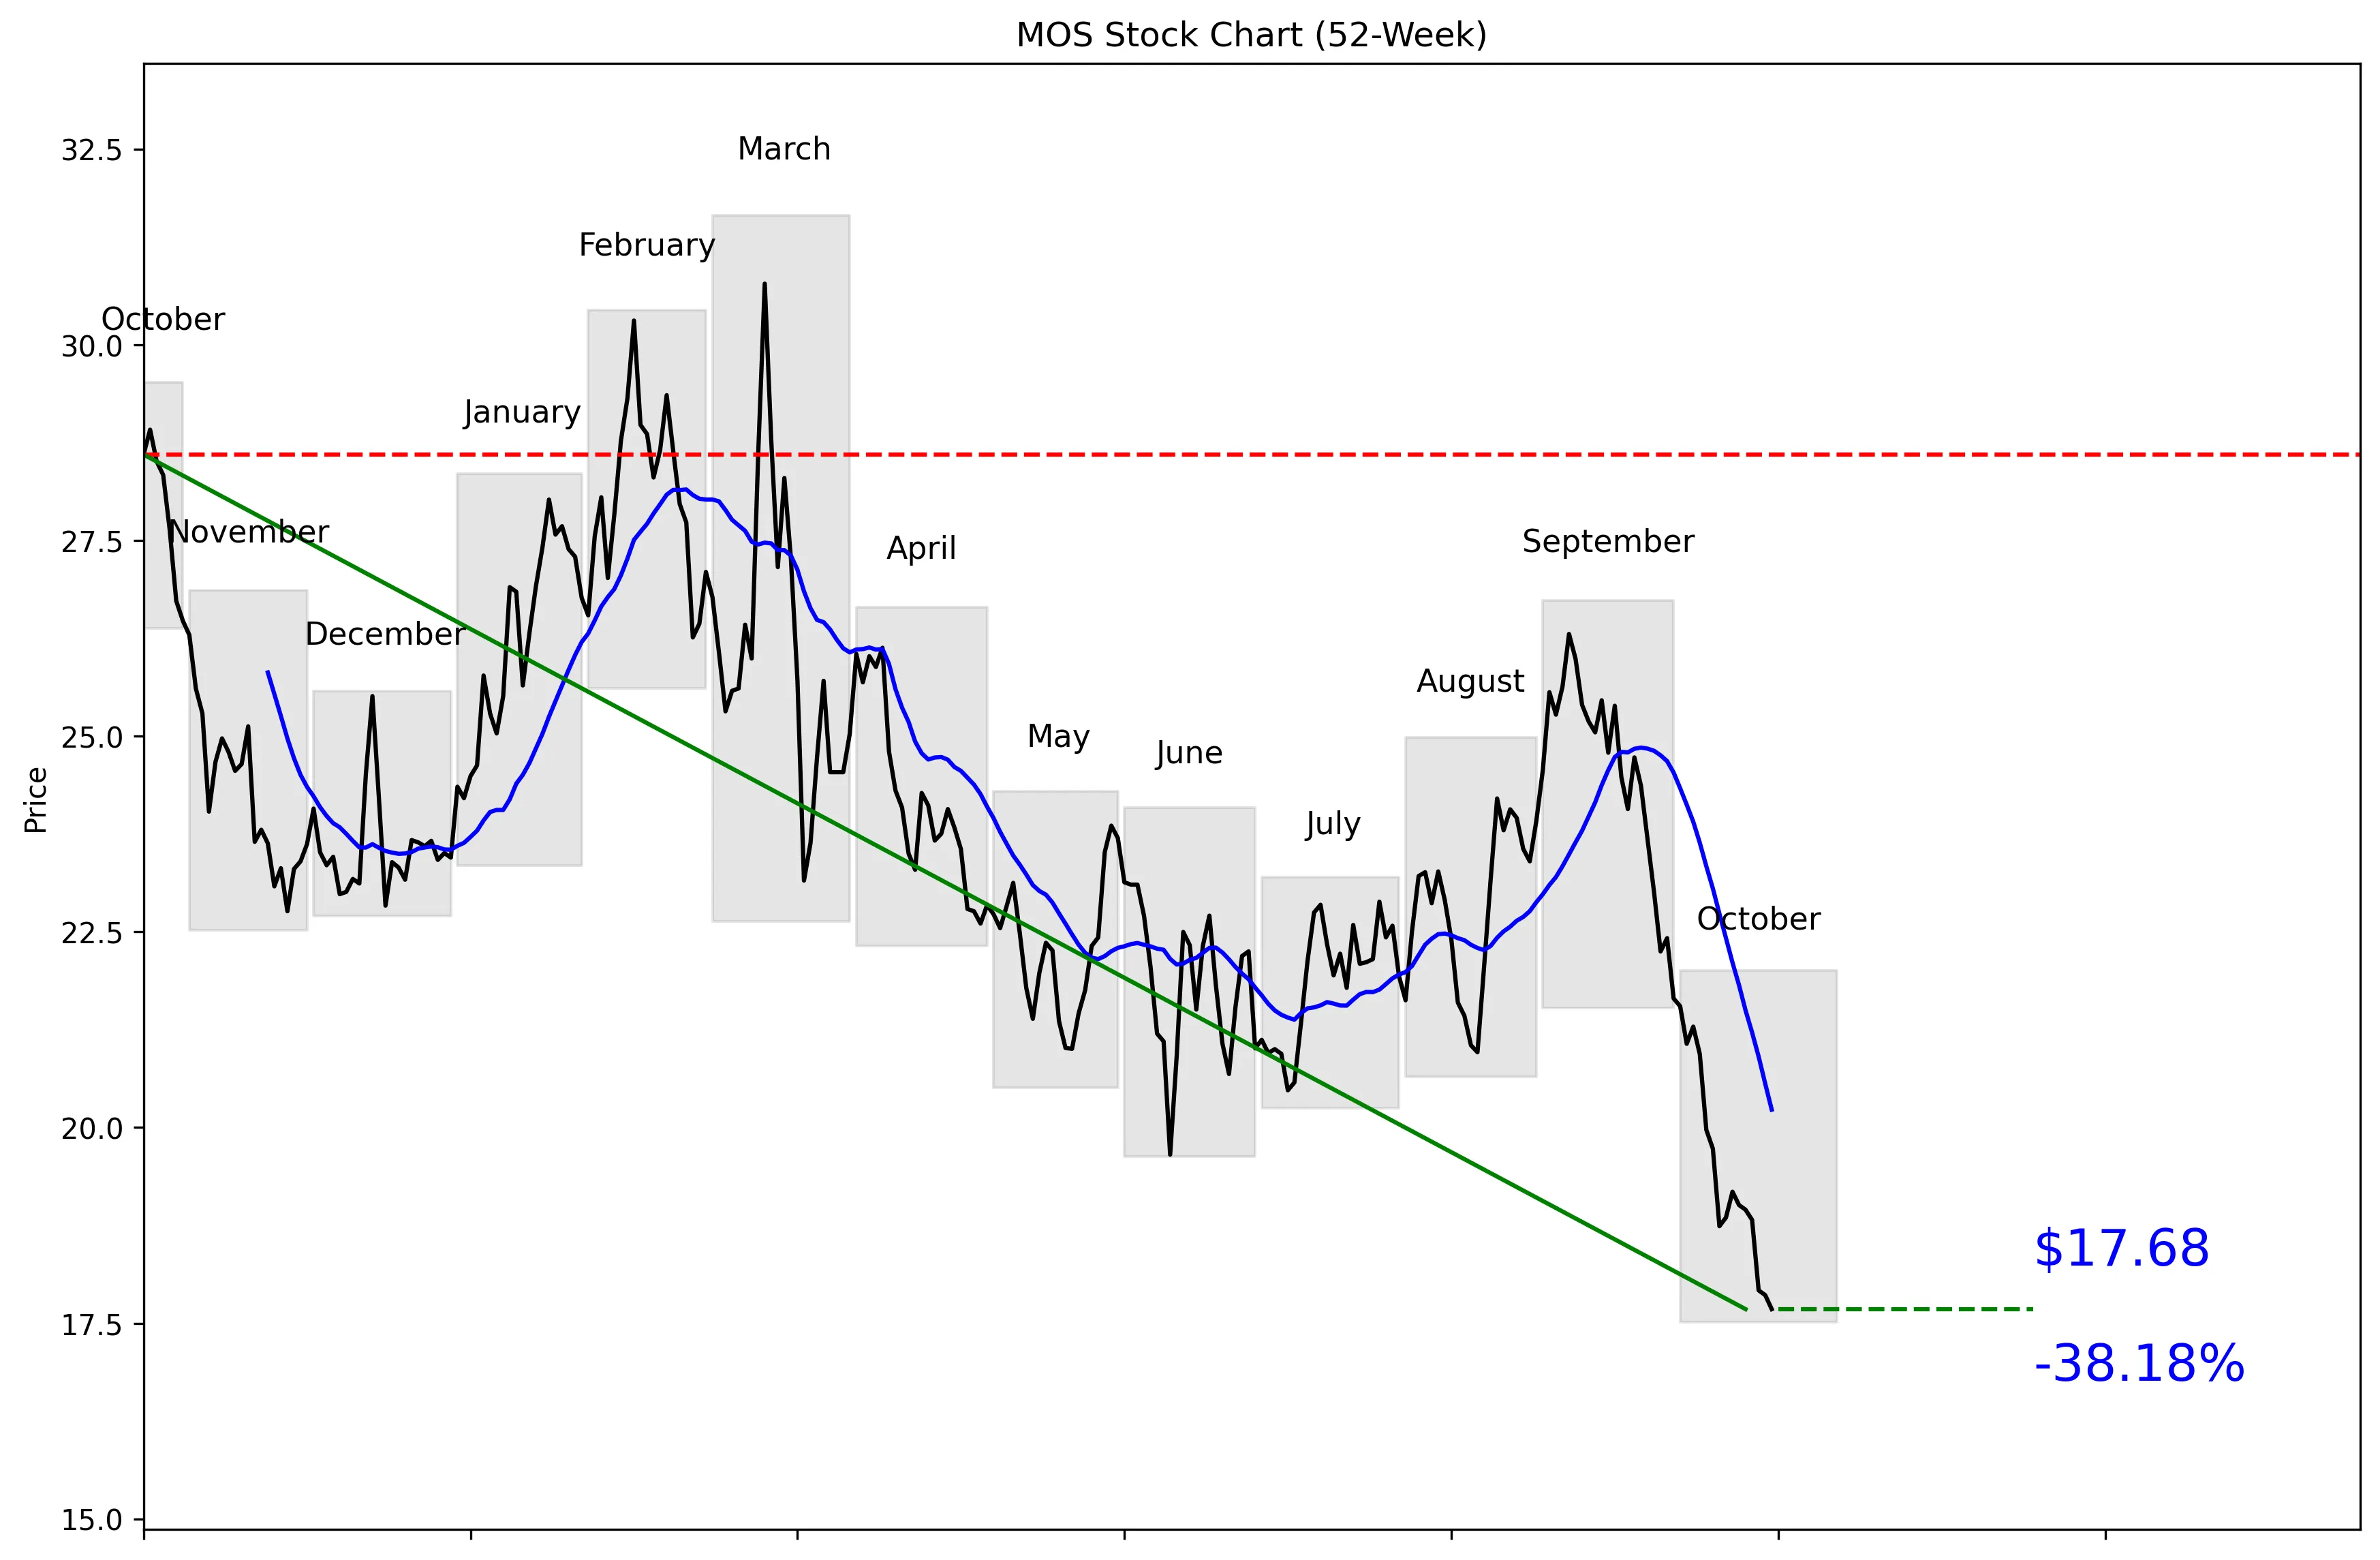
MOS 52-Week Stock Chart
Technical Analysis
MOS trades at $17.70, just 1% of the way from its exact 52-week low of $17.51 to its exact 52-week high of $31.66. The stock is 44.15% below that high and only 0.97% above the low. Price sits 12.60% below the 20-day moving average of $20.23, confirming a weak short-term trend. Momentum is negative, with declines of 7.00% over five trading days and 27.45% over 20 trading days. Near-term support is $17.68, while resistance is $25.46.


Recent News and Developments

Mosaic to cut 199 jobs at South Fort Meade

Mosaic will idle its South Fort Meade fertilizer plant and lay off 199 workers beginning December 8. The company cited sulfur supply constraints and extraordinary costs, and expects the shutdown to exceed six months. Source: FOX 13 Tampa Bay

Barclays cuts Mosaic price target to $22

Barclays analyst Benjamin Theurer maintained an Equal-Weight rating on Mosaic on October 16. The firm lowered its price target from $26 to $22. Source: Benzinga

Mosaic shares fall 4.89% in one session

Mosaic traded at $17.90 on October 19, down 4.89% from the previous close of $18.82. The report placed the company’s market value at $5.69 billion. Source: Global Banking & Finance Review


Market Sentiment and Analyst Recommendations

Bull Case
The bull case starts with valuation upside rather than business growth. MOS trades at $17.70, while the average analyst target is $26.27 and the highest target is $35.00. Eighteen analysts collectively rate the stock a buy. The company still generates $12.25 billion in revenue against a market capitalization of $5.63 billion. The stock is also only 0.97% above its exact 52-week low, so much of the current pessimism is already reflected in the price. Buyers here are betting that stabilization above $17.68 and a recovery toward the $20.23 moving average can reverse the current trend.
Bear Case
The operating picture is weak, with revenue growth at negative 6.0%. Mosaic has $6.08 billion in total debt and only $294.00 million in cash, leaving a wide gap between liquidity and debt. The P/E ratio is unavailable, so investors cannot use that metric to determine whether the stock is cheap relative to earnings. Mosaic is idling its South Fort Meade fertilizer plant for more than six months and laying off 199 workers beginning December 8 because of sulfur supply constraints and extraordinary costs. Barclays lowered its price target from $26 to $22 on October 16 while maintaining an Equal-Weight rating. The market is already punishing the stock: MOS fell 4.89% to $17.90 on October 19 and now sits 44.15% below its exact 52-week high.
What to Watch
The first threshold is $17.68, the 30-day low and immediate support level. A sustained move below that price would put the exact 52-week low of $17.51 back in focus. Bulls need MOS to reclaim its 20-day moving average of $20.23 before the technical picture improves. The next major test is $25.46, the 30-day high and near-term resistance level. Investors should track the South Fort Meade shutdown beginning December 8, particularly whether sulfur constraints and extraordinary costs keep the plant idle beyond the expected period of more than six months. Revenue growth also needs to improve from negative 6.0%, while any further analyst revisions should be compared with Barclays’ reduced $22 target and the broader $17.00-to-$35.00 target range.
Analyst Consensus
BUY

Based on 18 analyst opinions
Low Target
$17.00
Mean Target
$26.27
High Target
$35.00


Earnings and Financial Data

Sector
Basic Materials
Industry
Agricultural Inputs
Employees
13,000
Earnings & Dividends
Next Earnings
Nov 03, 2026
EPS (Trailing)
$-2.01
Dividend Yield
493.0%
Payout Ratio
628.6%

Frequently Asked Questions

Is MOS a good stock to buy?
Eighteen analysts give MOS a buy recommendation, and the average analyst target is $26.27 versus a current price of $17.70. The takeaway is that analysts see upside, but the stock’s negative momentum makes this a high-risk buy.
What is MOS’s price target?
The average analyst target is $26.27, with estimates ranging from $17.00 to $35.00. The takeaway is that analyst expectations vary widely.
What is MOS’s 52-week range?
The listed 52-week range is $17.59 to $32.25, while the exact price-series low and high are $17.51 and $31.66. The takeaway is that MOS is trading near the bottom of its yearly range.
Is MOS stock technically oversold?
No oversold indicator was provided, so that conclusion cannot be made from the available data. The stock is 12.60% below its 20-day moving average and has lost 27.45% over 20 trading days, so the takeaway is that momentum is clearly negative.
Does MOS pay a dividend?
The provided data does not include a dividend amount or yield. The takeaway is that no dividend conclusion can be made from this dataset.

Related Stock Reports

Disclaimer: This report is for informational purposes only and does not constitute financial advice. The analysis and opinions expressed are those of AltStation.io and should not be relied upon as the sole basis for investment decisions. Always conduct your own research and consult with a qualified financial advisor before making investment decisions. Past performance does not guarantee future results. Updated October 22, 2026.