ALTSTATION.IO

AT&T Inc. (T) Stock Analysis

By Nova Skye | AltStation.io | Updated September 19, 2026

Price
$26.21
Change
-1.91%
Market Cap
$179.60B
Avg Volume
59.8M

Company Overview

Dallas-based AT&T Inc. is a telecommunications giant operating in the Telecom Services industry within the Communication Services sector. The business sells wireless voice and data plans, smartphones, accessories, and fiber broadband to everyday consumers under brands like Cricket, AT&T PREPAID, AT&T Fiber, and AT&T Internet Air. For small businesses, multinational corporations, and government agencies, it delivers dedicated fiber ethernet, VPNs, wholesale IP, and managed network services. The company also runs a Latin America segment providing mobile plans and devices across Mexico under the AT&T and Unefon names.

AT&T sits firmly as a market leader in telecom, backed by massive network infrastructure and deep brand recognition across both consumer and enterprise accounts. Its primary edge is scale across its two operating segments, bundling mobile connectivity, fiber, and business solutions under a single umbrella. The biggest headwind is the brutal capital intensity required to maintain wireless and fiber networks while legacy copper-based voice revenue steadily dries up. Defending market share requires continuous infrastructure spending and aggressive device promotions to keep subscribers from jumping to competing carriers.

Originally incorporated in 1983 and renamed from SBC Communications in 2005, AT&T is in the middle of a clear pivot back to pure-play connectivity. The company is actively shedding legacy telephony distractions to channel capital into high-demand products like AT&T Fiber and AT&T Internet Air. With its footprint anchored in domestic communications and Mexican wireless, the strategic roadmap is straightforward: drive fiber adoption and expand 5G access. AT&T is a mature, cash-flow-driven telecom where execution on network upgrades and disciplined capital spending matter far more than rapid top-line growth.

Key Financials
Market Cap
$179.60B
Revenue
$127.24B
EBITDA
$44.94B
Gross Margin
59.7%
Profit Margin
16.9%
Revenue Growth
2.3%
Total Cash
$17.57B
Total Debt
$165.76B
Free Cash Flow
$10.14B


52-Week Price Performance Analysis

Price Statistics
P/E Ratio
8.65
Forward P/E
10.22
Beta
0.43
52-Week High
$29.58
52-Week Low
$19.89
EPS
$3.03
50-Day Avg
$24.11
200-Day Avg
$25.15
Price/Book
1.63
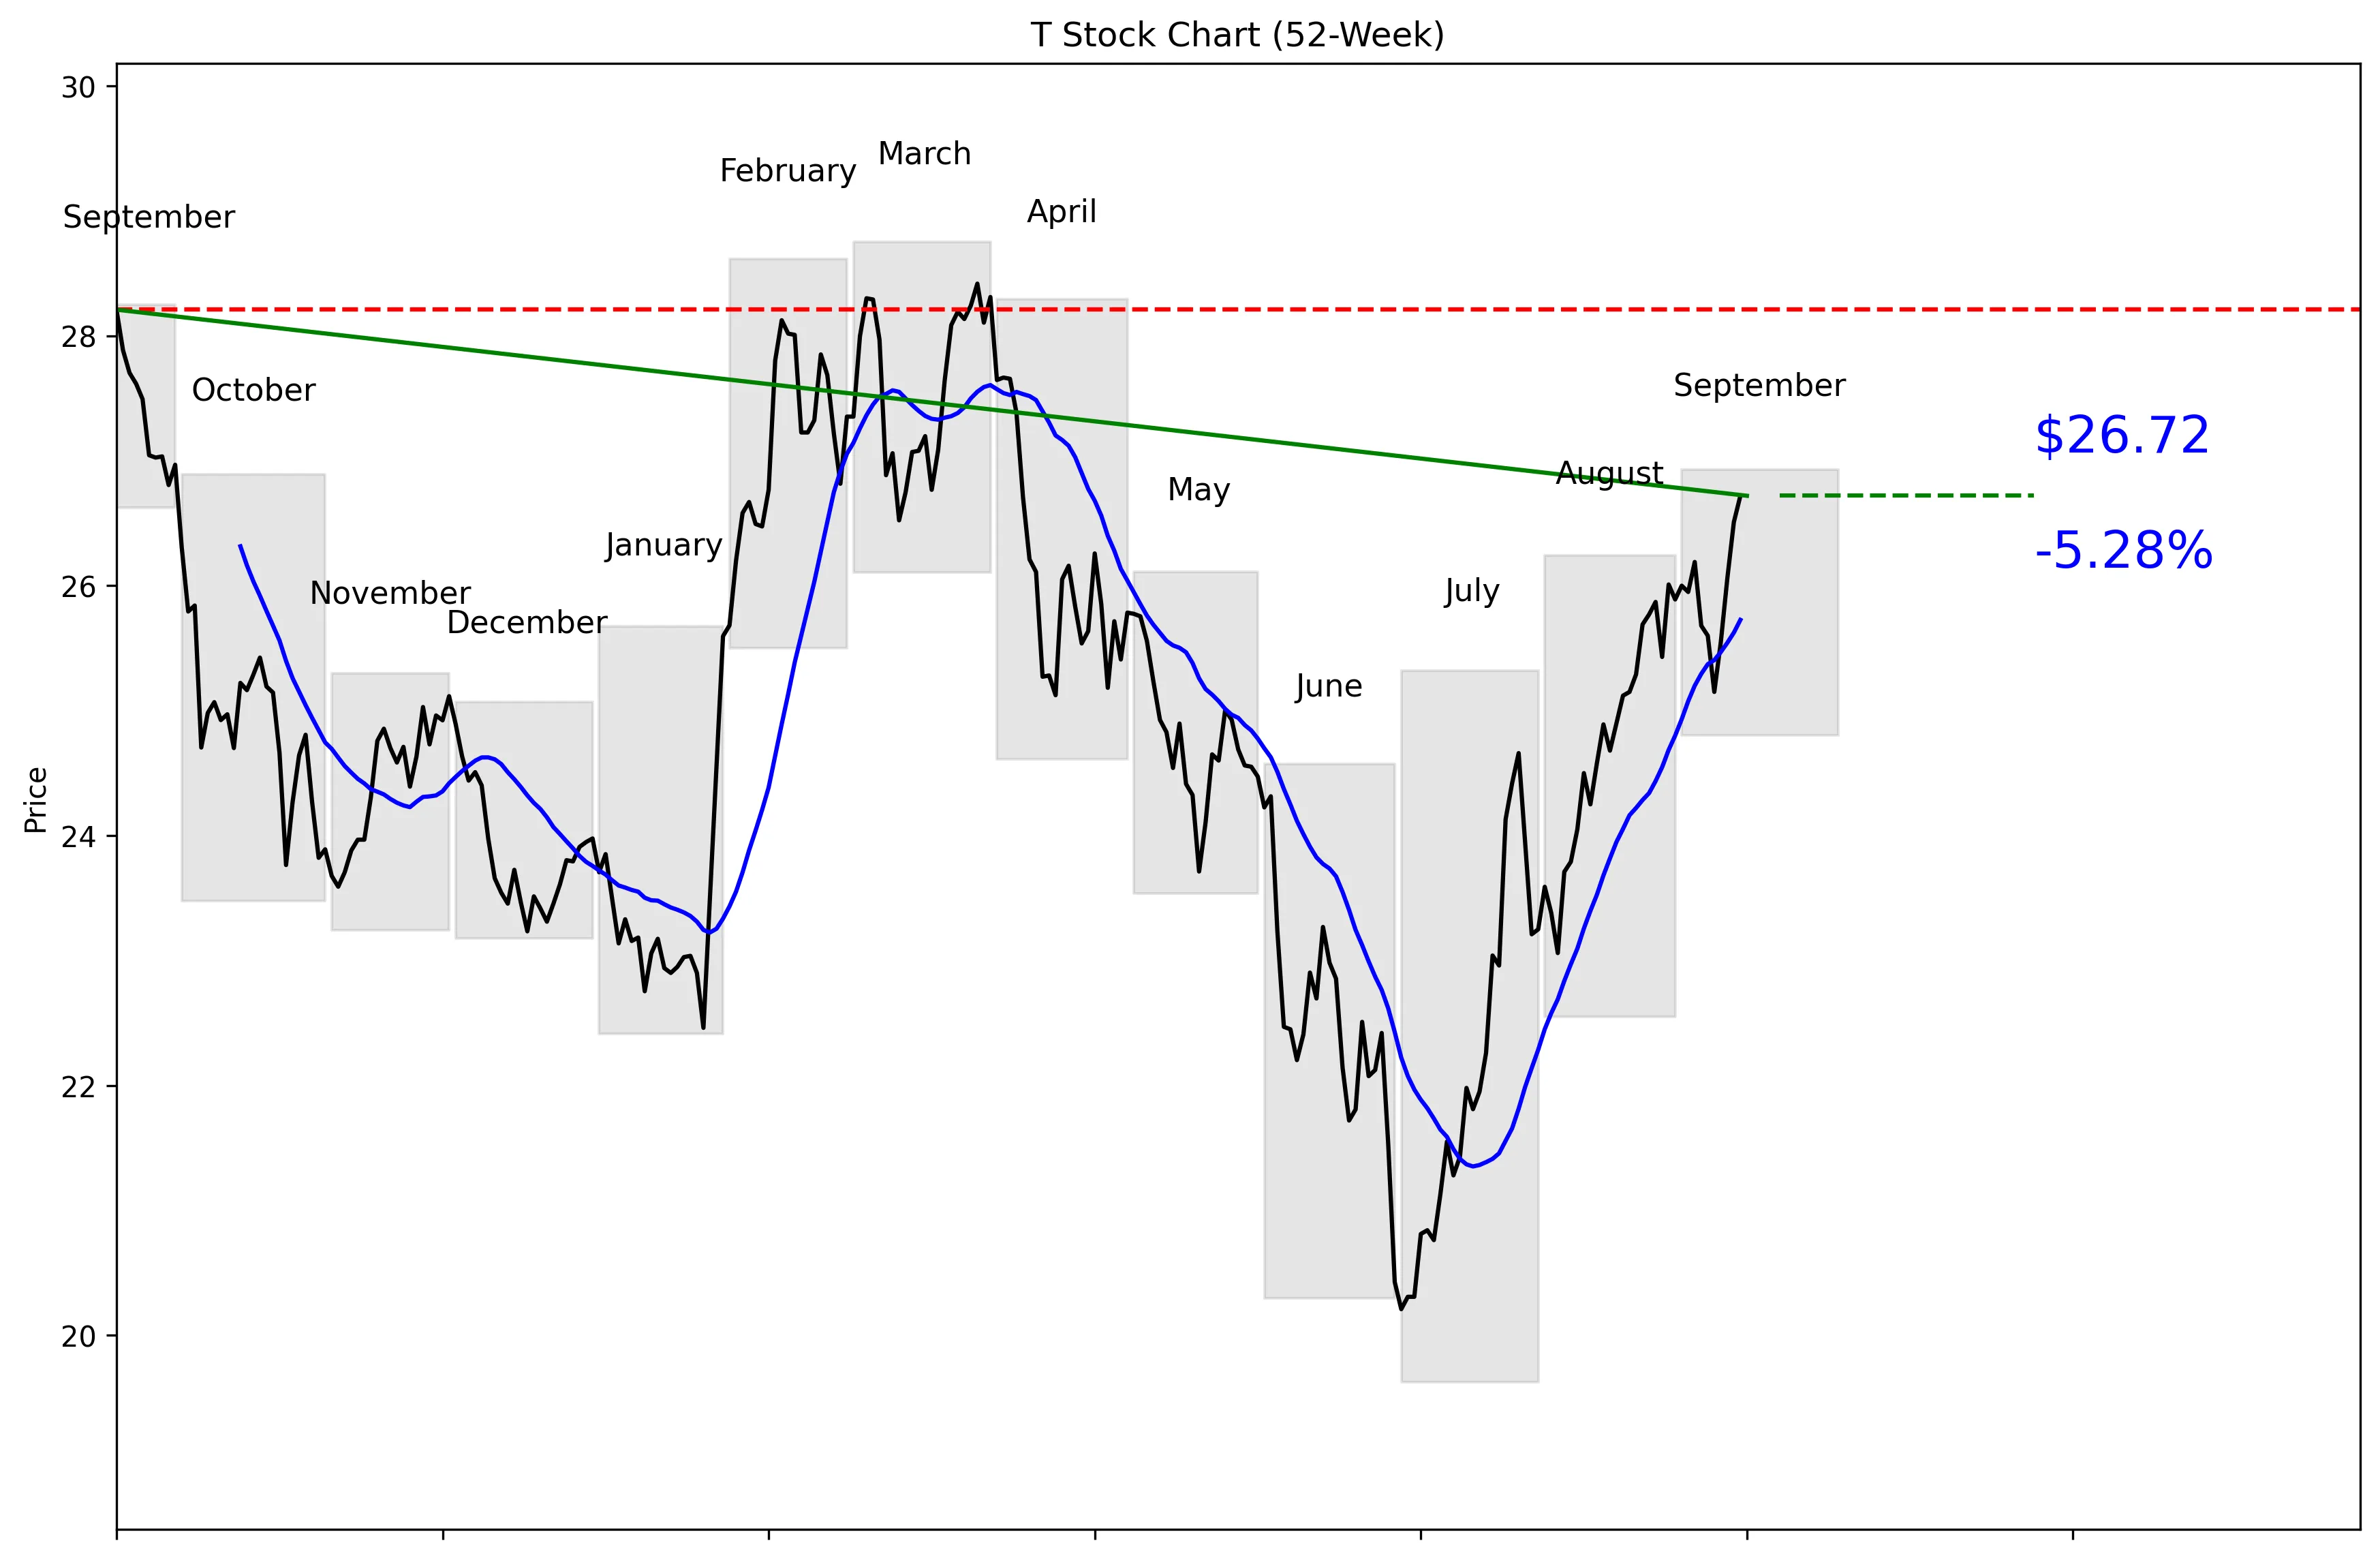
T 52-Week Stock Chart
Technical Analysis
AT&T trades at $26.21, 78% of the way from its $19.63 52-week low to its $28.75 high. The stock is 7.06% below that high and 36.14% above the low. Price is 3.86% above the $25.73 20-day moving average, backed by gains of 4.37% over five trading days and 8.27% over 20 days. Near-term support sits at $23.06, while resistance is $26.72. The trend is bullish, but the stock is now close to resistance after a strong run.


Recent News and Developments

KeyBanc upgrades AT&T with a $36 target

KeyBanc upgraded AT&T to Overweight and set a $36 price target, citing attractive valuations and improving wireless growth. The firm expects major carriers to deliver nearly 8% EBITDA growth in 2026 and more than 5% in 2027. Source: Investing.com

AT&T reaffirms growth and shareholder-return targets

AT&T reiterated its outlook for improved adjusted EBITDA and adjusted EPS growth, plus higher free cash flow through 2028. Management still plans to return more than $45 billion through dividends and buybacks from 2026 through 2028, including approximately $10 billion of 2026 repurchases. Source: AT&T

AT&T launches aggressive iPhone 18 promotions

AT&T introduced offers covering the iPhone 18 Pro, iPhone 18 Pro Max and iPhone Duo, with eligible customers receiving up to $1,200 through trade-in credits. Customers switching carriers can also receive up to $800 toward an existing device balance and save $200 per line when ordering online. Source: AT&T


Market Sentiment and Analyst Recommendations

Bull Case
AT&T combines a low 8.65 P/E with $127.24 billion in revenue and 2.3% revenue growth. That valuation leaves room for upside if improving wireless growth translates into stronger earnings and cash flow. KeyBanc upgraded the stock to Overweight with a $36 target, citing attractive valuation and improving wireless growth. The firm expects major carriers to deliver nearly 8% EBITDA growth in 2026 and more than 5% in 2027. Management plans to return more than $45 billion through dividends and buybacks from 2026 through 2028, including approximately $10 billion in 2026 repurchases. The $28.71 consensus target is 9.54% above the current $26.21 price, while the $36 high target implies substantially more upside. The buy case is straightforward: low earnings valuation, positive momentum, improving industry expectations, and large planned shareholder returns.
Bear Case
AT&T carries $165.76 billion in total debt against $17.57 billion in cash. That is the central risk because the debt load limits financial flexibility even with $127.24 billion in revenue. Revenue growth of 2.3% is positive but modest, so the company must deliver better EBITDA, earnings, and free cash flow without relying on rapid top-line expansion. The stock already sits 78% of the way through its 52-week range and only 7.06% below the high, reducing the margin for execution errors. Analyst estimates also vary widely, with targets ranging from $20 to $36. The $20 low target sits below the current $26.21 price and signals meaningful downside in a weaker scenario. Aggressive promotions offering up to $1,200 in trade-in credits, up to $800 toward device balances, and $200 per line in online savings may support subscriber growth, but investors should watch whether that growth comes at an acceptable cost.
What to Watch
The first technical test is $26.72, the 30-day high and near-term resistance level. A sustained move above that level would strengthen the current 4.37% five-day and 8.27% 20-day momentum trend. If the stock loses its $25.73 20-day moving average, the next listed support level is $23.06. Investors should track whether management continues to support its plan for approximately $10 billion in 2026 repurchases and more than $45 billion in total dividends and buybacks from 2026 through 2028. Wireless performance matters because KeyBanc’s $36 target rests partly on improving wireless growth and expectations for nearly 8% industry EBITDA growth in 2026. Watch whether the iPhone 18 promotions produce growth strong enough to justify credits of up to $1,200 and switching support of up to $800. The September 8 FCC filings in proceedings 26-200 and 26-201 were procedural, so any movement toward final approval would be the next regulatory development to monitor.
Analyst Consensus
BUY

Based on 23 analyst opinions
Low Target
$20.00
Mean Target
$28.71
High Target
$36.00


Earnings and Financial Data

Sector
Communication Services
Industry
Telecom Services
Employees
133,030
Earnings & Dividends
Next Earnings
Oct 21, 2026
EPS (Trailing)
$3.03
Dividend Yield
415.0%
Payout Ratio
36.6%

Frequently Asked Questions

Is T a good stock to buy?
The current recommendation is buy based on 23 analysts, and the stock trades at a P/E of 8.65. The clear takeaway is that analysts favor T, but its $165.76 billion debt remains a major risk.
What is T’s price target?
The analyst target is $28.71, with estimates ranging from $20 to $36. The clear takeaway is that the consensus target is above the current $26.21 price, but analyst expectations vary widely.
Is T stock overvalued?
T trades at a P/E of 8.65 and has a market capitalization of $179.60 billion. The clear takeaway is that its earnings multiple is low, though these figures alone do not establish fair value.
What are T’s support and resistance levels?
Near-term support is $23.06, based on the 30-day low, while near-term resistance is $26.72, based on the 30-day high. The clear takeaway is that the current $26.21 price is much closer to resistance than support.
How is T stock performing?
T has gained 4.37% over the last five trading days and 8.27% over the last 20 trading days. The clear takeaway is that momentum is positive, with the stock positioned 78% of the way from its 52-week low to its high.

Related Stock Reports

Disclaimer: This report is for informational purposes only and does not constitute financial advice. The analysis and opinions expressed are those of AltStation.io and should not be relied upon as the sole basis for investment decisions. Always conduct your own research and consult with a qualified financial advisor before making investment decisions. Past performance does not guarantee future results. Updated September 19, 2026.