ALTSTATION.IO

Verizon Communications Inc. (VZ) Stock Analysis

By Nova Skye | AltStation.io | Updated November 01, 2026

Price
$44.73
Change
+2.45%
Market Cap
$185.39B
Avg Volume
23.3M

Company Overview

Verizon Communications is a major telecom operator in the Communication Services sector, headquartered in New York. The company sells mobile wireless connectivity, broadband internet, and connected devices like smartphones and tablets to consumers, businesses, and government entities. Operations run through two primary divisions: the Verizon Consumer Group, which manages retail wireless plans and the TracFone brand, and the Verizon Business Group, which handles corporate networking, security, and IoT services. On the wireline side, it delivers fiber-optic internet across the Mid-Atlantic and Northeastern United States through its Verizon Fios network alongside legacy copper lines.

Verizon holds a market leader position in the United States telecom industry, anchored by its extensive national wireless network and millions of recurring subscription accounts. Its primary edge is physical infrastructure scale, combining high-capacity wireless coverage with dense fiber assets in key metropolitan regions. The core threat is the massive capital expenditure required to maintain that infrastructure, alongside intense price competition across the wireless carrier space. Retaining subscribers requires continuous promotional spending and heavy network investment, which constantly limits margin expansion.

Right now, Verizon is pushing fixed wireless access broadband and fiber expansion to offset the structural decline of its legacy copper network. The strategy centers on converting wireless capacity into home and business broadband accounts while scaling managed IT and IoT products for enterprise clients. With core domestic smartphone penetration essentially saturated, broadband additions represent the main engine for volume growth. The company functions as a heavy cash-flow generator where capital allocation and network efficiency matter far more than rapid top-line growth.

Key Financials
Market Cap
$185.39B
Revenue
$139.39B
EBITDA
$50.98B
Gross Margin
59.7%
Profit Margin
11.8%
Revenue Growth
1.5%
Total Cash
$4.50B
Total Debt
$188.97B
Free Cash Flow
$17.98B


52-Week Price Performance Analysis

Price Statistics
P/E Ratio
11.41
Forward P/E
8.43
Beta
0.25
52-Week High
$51.68
52-Week Low
$38.68
EPS
$3.92
50-Day Avg
$47.04
200-Day Avg
$46.82
Price/Book
1.75
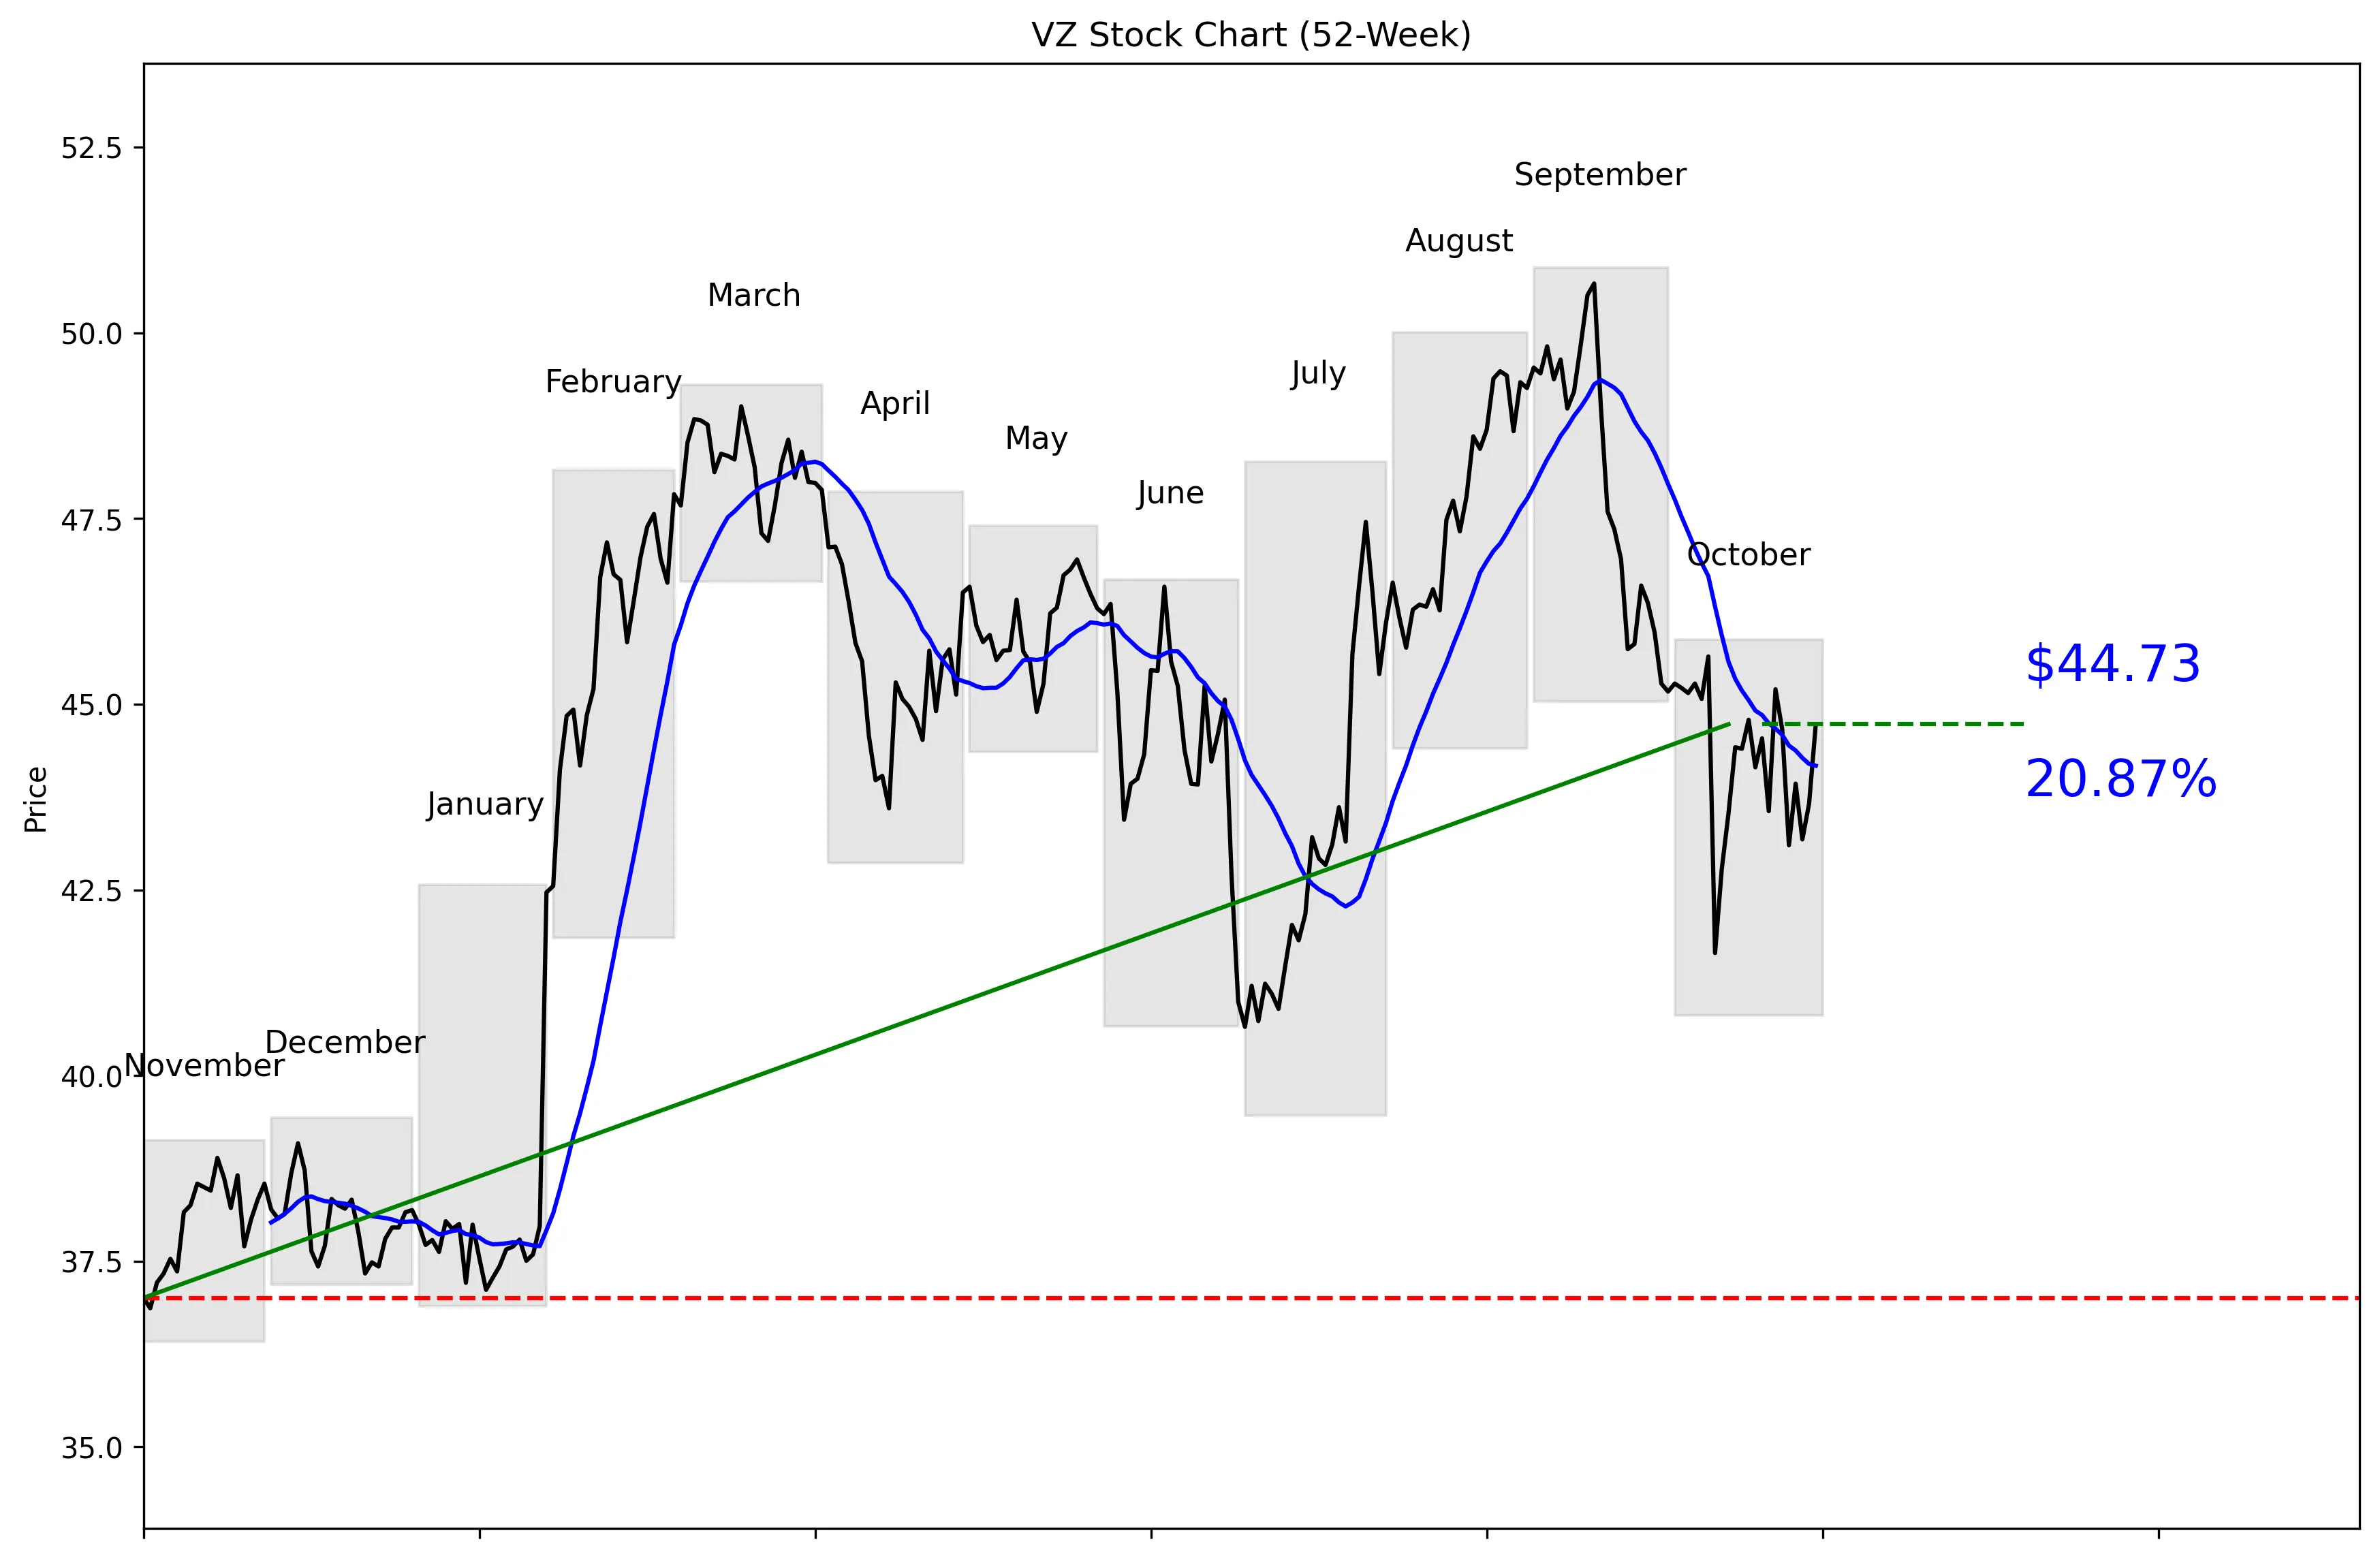
VZ 52-Week Stock Chart
Technical Analysis
VZ trades at $44.73, 57% of the way from its $36.42 52-week low to its $50.88 high. The stock is 12.09% below that high and 22.83% above the low. Price sits 1.27% above the 20-day moving average of $44.17. Momentum is weak, with a 0.16% gain over five trading days and a 1.08% decline over 20 trading days. Near-term support is $41.65, while resistance sits at $46.95.


Recent News and Developments

Verizon beats Q3 earnings and raises guidance

Verizon reported adjusted EPS of $1.31, up 8.3% year over year, while revenue increased 1.5% to $34.3 billion. The company added 406,000 postpaid phone customers and raised its 2026 adjusted EPS forecast to $5.04-$5.06. Source: Verizon

Revenue miss sends Verizon shares down 2.8%

Verizon shares fell 2.8% in morning trading on October 26 after revenue of $34.31 billion missed the $34.77 billion estimate. The decline came despite the earnings beat and stronger guidance, showing investors remain focused on weak top-line growth. Source: Investing.com

TD Cowen trims Verizon target to $55

TD Cowen lowered its Verizon price target from $56 to $55 while keeping its Buy rating. The firm credited strong phone additions and raised guidance but said concerns about SpaceX competition continue to weigh on the stock. Source: Investing.com


Market Sentiment and Analyst Recommendations

Bull Case
Verizon delivered adjusted Q3 EPS of $1.31, up 8.3% year over year. Revenue increased 1.5% to $34.3 billion, and the company added 406,000 postpaid phone customers. Management raised its 2026 adjusted EPS forecast to $5.04-$5.06, giving investors a clear earnings catalyst. The stock trades at 11.41 times earnings, a modest valuation if Verizon can sustain EPS growth. The $50.65 consensus target represents 13.24% upside from $44.73, with the most bullish analyst target at $62.00. Freedom Broker upgraded the stock to Buy with a $55 target, while TD Cowen maintained its Buy rating with the same target. The buy case is straightforward: improving earnings, strong phone additions and a low earnings multiple outweigh the slow revenue growth at the current price.
Bear Case
Revenue growth is only 1.5%, which is not enough to support a major revaluation without stronger earnings execution. Q3 revenue of $34.31 billion missed the $34.77 billion estimate, and the stock fell 2.8% on October 26 despite the earnings beat. That reaction shows investors care more about weak top-line growth than management’s improved guidance. Verizon carries $188.97 billion in total debt against just $4.50 billion in cash, leaving very little balance-sheet flexibility. The stock is also below its $46.95 near-term resistance and has declined 1.08% over the last 20 trading days. TD Cowen cut its target from $56 to $55 and cited competition from SpaceX as an ongoing concern. Verizon is cheap at 11.41 times earnings, but slow growth, heavy debt and competitive pressure give the market valid reasons to keep the multiple low.
What to Watch
The first test is whether Verizon can deliver its raised 2026 adjusted EPS forecast of $5.04-$5.06. Investors should also track whether revenue growth improves from 1.5% after Q3 revenue missed expectations by $0.46 billion. Postpaid phone additions need to remain strong after the company added 406,000 customers in Q3. On the chart, a move above $46.95 would clear near-term resistance, while a drop below $41.65 would break near-term support. The $44.17 20-day moving average is another useful threshold because the stock currently trades only 1.27% above it. Analyst revisions matter after TD Cowen lowered its target to $55 while Freedom Broker raised its target to $55 on October 28. Verizon’s public-safety app challenge is open through April 2, 2027, but the central thesis still depends on earnings growth, revenue execution and competitive pressure rather than that initiative.
Analyst Consensus
BUY

Based on 22 analyst opinions
Low Target
$44.00
Mean Target
$50.65
High Target
$62.00


Earnings and Financial Data

Sector
Communication Services
Industry
Telecom Services
Employees
93,300
Earnings & Dividends
Next Earnings
Oct 26, 2026
EPS (Trailing)
$3.92
Dividend Yield
633.0%
Payout Ratio
71.8%

Frequently Asked Questions

Is VZ a good stock to buy?
The current recommendation is buy based on 22 analysts, and VZ trades at a P/E of 11.41. The takeaway is that analysts are positive, but investors must weigh the valuation against 1.5% revenue growth and $188.97 billion in debt.
What is VZ’s price target?
The average analyst target is $50.65, with estimates ranging from $44.00 to $62.00. The takeaway is that the average target sits 13.24% above the current $44.73 price.
Is VZ stock undervalued?
VZ trades at 11.41 times earnings and sits 12.09% below its technical 52-week high of $50.88. The takeaway is that the valuation is modest, but the provided data does not establish a definitive fair value.
What are VZ’s support and resistance levels?
Near-term support is the 30-day low of $41.65, while near-term resistance is the 30-day high of $46.95. The takeaway is that those are the key levels around the current $44.73 price.
How much debt does Verizon have?
Verizon has $188.97 billion in total debt and $4.50 billion in total cash. The takeaway is that debt is a major risk relative to the company’s available cash.

Related Stock Reports

Disclaimer: This report is for informational purposes only and does not constitute financial advice. The analysis and opinions expressed are those of AltStation.io and should not be relied upon as the sole basis for investment decisions. Always conduct your own research and consult with a qualified financial advisor before making investment decisions. Past performance does not guarantee future results. Updated November 01, 2026.