ALTSTATION.IO

Texas Instruments Incorporated (TXN) Stock Analysis

By Nova Skye | AltStation.io | Updated September 19, 2026

Price
$272.09
Change
+5.13%
Market Cap
$248.49B
Avg Volume
7.7M

Company Overview

Texas Instruments Incorporated, founded in 1930 and headquartered in Dallas, Texas, is a core hardware anchor in the technology sector specializing in semiconductors. The company operates through 2 core business units: Analog and Embedded Processing. Their catalog spans critical hardware components, including battery-management power switches, signal chain amplifiers, microcontrollers, radar chips, and DLP projection tech. They sell directly, through their website, and via distributors to electronics manufacturers across 6 core markets, led by industrial, automotive, and enterprise systems.

Texas Instruments holds an established market leadership position in analog and embedded chips rather than chasing volatile consumer processor hype. Their primary competitive edge is the sheer ubiquity of their catalog and the long lifecycles of industrial and automotive equipment, where hardware designs stay locked in for years. The biggest operational headwind stems from macroeconomic cyclicality and inventory swings across major international manufacturing hubs in China, Asia, and Europe. Even so, the sheer breadth of their signal-chain and power catalog creates an operational moat that niche chip suppliers cannot match.

Right now, TI remains focused on high-reliability industrial and automotive applications while maintaining a massive global distribution footprint across the Americas, Europe, Africa, and Asia. The strategic posture favors steady margin discipline and direct customer relationships over chasing short-lived consumer gadget cycles. With broad exposure across both power management and embedded processing, the company operates as a core bellwether for real-economy hardware production.

Key Financials
Market Cap
$248.49B
Revenue
$19.45B
EBITDA
$9.52B
Gross Margin
58.3%
Profit Margin
31.1%
Revenue Growth
22.8%
Total Cash
$7.00B
Total Debt
$14.05B
Free Cash Flow
$3.55B


52-Week Price Performance Analysis

Price Statistics
P/E Ratio
41.41
Forward P/E
25.56
Beta
1.31
52-Week High
$334.03
52-Week Low
$152.73
EPS
$6.57
50-Day Avg
$278.24
200-Day Avg
$240.94
Price/Book
13.80
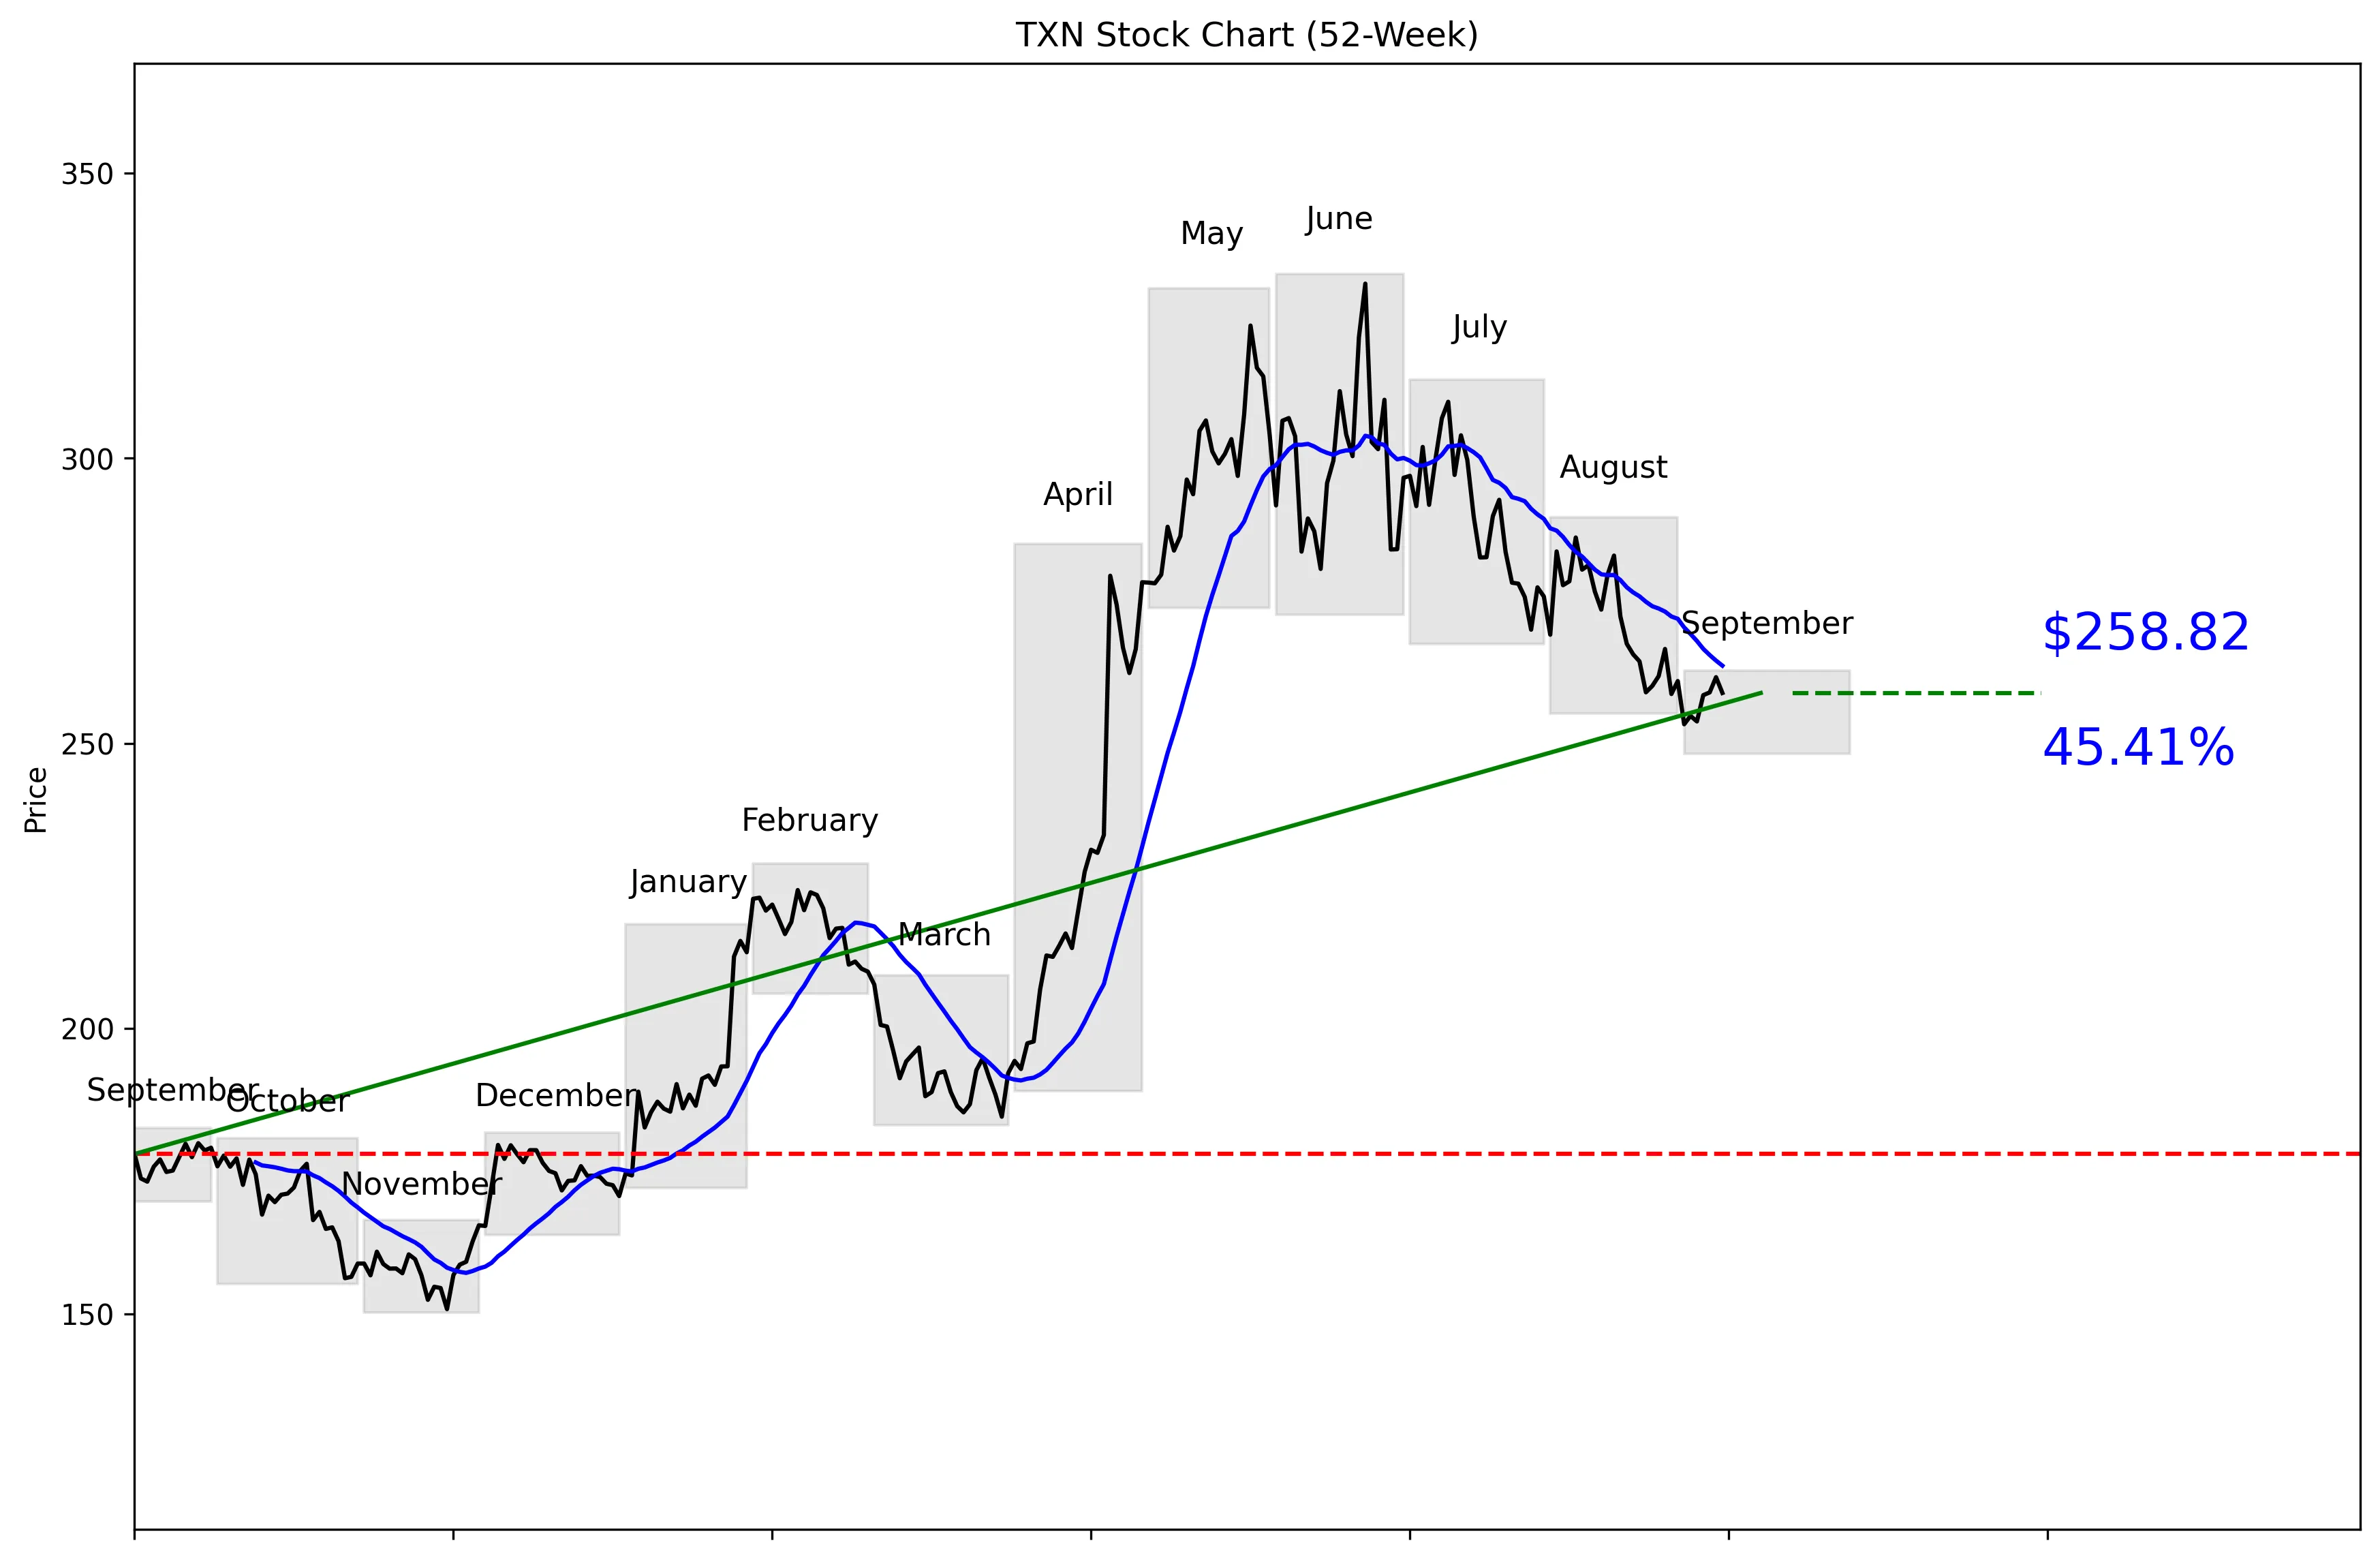
TXN 52-Week Stock Chart
Technical Analysis
TXN trades at $272.09, placing it 60% of the way from its 52-week low of $150.20 to its 52-week high of $332.33. The stock is 22.12% below that high but remains 72.31% above the low. Five-day momentum is positive at 1.58%, while 20-day momentum is negative at 6.42%. The supplied technical data places the stock 1.82% below its 20-day moving average of $263.61. Near-term support is $253.34, while $286.08 is the resistance level buyers need to clear.


Recent News and Developments

Cantor keeps TXN at Neutral with a $340 target

Cantor Fitzgerald reiterated its Neutral rating and $340 price target on September 9. The firm likes analog-semiconductor valuations but ranked TXN fourth among five covered names, behind ADI, NXPI and MCHP. Source: Investing.com

Zacks maintains an Outperform view on TXN

Zacks said TXN’s shares gained 44.4% over the past year, beating the semiconductor industry’s 33.9% return. It cited stronger industrial, data-center and automotive demand, expanding 300-millimeter manufacturing capacity and the pending Silicon Labs acquisition, while flagging debt, trade exposure and higher manufacturing costs. Source: Yahoo Finance

TXN gives back its September 9 gain

TXN rose 1.03% to $261.59 on September 9, then fell 1.06% to $258.82 on September 10. The stock finished the five-session period up just 0.15%, so the recent analyst commentary produced no meaningful breakout. Source: MarketBeat


Market Sentiment and Analyst Recommendations

Bull Case
Revenue growth of 22.8% shows that demand is moving in the right direction. Zacks points to stronger industrial, data-center and automotive demand, giving TXN multiple growth engines rather than one narrow bet. The company is expanding its 300-millimeter manufacturing capacity, which could strengthen production economics as demand grows. The pending Silicon Labs acquisition adds another potential catalyst. TXN has already gained 44.4% over the past year, outperforming the semiconductor industry’s 33.9% return. The $324.71 analyst target is above the current $272.09 price, while the top target reaches $400.00. The buy case is straightforward: strong revenue growth, broad end-market demand and additional manufacturing capacity can support further upside.
Bear Case
A P/E of 41.41 leaves little room for weak execution. The stock is already 72.31% above its 52-week low, so buyers are not entering after a deep reset. Total debt of $14.05 billion is substantially higher than total cash of $7.00 billion. Zacks also flagged trade exposure and higher manufacturing costs, both of which could pressure results. The Silicon Labs acquisition adds integration and balance-sheet risk even if the strategic logic proves sound. Cantor kept TXN at Neutral and ranked it fourth among five covered analog-semiconductor names, behind ADI, NXPI and MCHP. With 20-day momentum at negative 6.42%, the market is demanding proof before paying an even richer valuation.
What to Watch
The first technical test is whether TXN can break above the 30-day resistance level of $286.08. A drop below the 30-day support level of $253.34 would weaken the near-term setup. Investors should also track whether five-day momentum of 1.58% develops into a sustained reversal of the negative 6.42% 20-day trend. Ezurio expects production kits and modules using TI chips in October, providing a concrete checkpoint for edge-AI adoption. Revenue growth needs to remain strong relative to the current 22.8% rate to support a P/E of 41.41. Progress on 300-millimeter manufacturing capacity and the pending Silicon Labs acquisition will show whether TXN can convert its investment plans into stronger operating performance. The balance sheet also matters: cash of $7.00 billion against debt of $14.05 billion limits the margin for costly execution mistakes.
Analyst Consensus
NONE

Based on 31 analyst opinions
Low Target
$225.00
Mean Target
$324.71
High Target
$400.00


Earnings and Financial Data

Sector
Technology
Industry
Semiconductors
Employees
33,000
Earnings & Dividends
Next Earnings
Oct 27, 2026
EPS (Trailing)
$6.57
Dividend Yield
219.0%
Payout Ratio
85.4%

Frequently Asked Questions

Is TXN a good stock to buy?
TXN has 22.8% revenue growth, but its P/E of 41.41 sets a high bar for future performance. The takeaway is that TXN offers growth, but the valuation demands continued execution.
What is TXN’s price target?
The analyst target is $324.71, with estimates ranging from $225.00 to $400.00. The takeaway is that analyst expectations cover a wide range of outcomes.
What is TXN’s 52-week high and low?
The technical price series shows a 52-week high of $332.33 and a low of $150.20. At $272.09, TXN is 22.12% below the high and 72.31% above the low, so the takeaway is that the stock sits well above its bottom but below its peak.
What are TXN’s support and resistance levels?
Near-term support is the 30-day low of $253.34, while resistance is the 30-day high of $286.08. The takeaway is that these are the key levels defining the current trading range.
How much cash and debt does Texas Instruments have?
Texas Instruments has $7.00 billion in total cash and $14.05 billion in total debt. The takeaway is that debt materially exceeds the company’s cash balance.

Related Stock Reports

Disclaimer: This report is for informational purposes only and does not constitute financial advice. The analysis and opinions expressed are those of AltStation.io and should not be relied upon as the sole basis for investment decisions. Always conduct your own research and consult with a qualified financial advisor before making investment decisions. Past performance does not guarantee future results. Updated September 19, 2026.