ALTSTATION.IO

Union Pacific Corporation (UNP) Stock Analysis

By Nova Skye | AltStation.io | Updated October 16, 2026

Price
$287.49
Change
-0.42%
Market Cap
$170.79B
Avg Volume
2.6M

Company Overview

Union Pacific Corporation is a freight railroad giant in the Industrials sector, founded in 1862 and headquartered in Omaha, Nebraska. Operating through its primary rail subsidiary, the company moves heavy freight across the western United States, serving grain processors, industrial chemical producers, automakers, and retail shippers. Its core business lines haul agricultural goods, coal, industrial products, construction materials, finished vehicles, and intermodal shipping containers. Customers pay for long-haul bulk transportation that trucking fleets cannot economically match.

Union Pacific operates as one half of a dominant rail duopoly in the western United States, controlling approximately 32,200 route miles across 23 states. Its only direct rail peer with comparable territory is BNSF Railway, which commands roughly 32,500 route miles. This massive physical footprint gives Union Pacific an insurmountable economic moat because laying parallel track today is virtually impossible. The primary threats to its franchise are long-haul trucking carriers on shorter freight corridors and cyclical volume declines in bulk commodities like coal.

Right now, Union Pacific is focused on tight cost discipline and margin preservation, posting an operating ratio of 59.7% on trailing twelve-month revenue of approximately $24.70 billion. Rather than pursuing speculative volume growth, the company is squeezing efficiency out of its existing network through precision scheduling and improved train velocity. While freight volumes across the broader logistics industry remain sluggish, Union Pacific maintains the pricing power required to protect its core profitability. The business stands as an exceptionally durable cash generator designed to deliver steady returns regardless of broader economic headwinds.

Key Financials
Market Cap
$170.79B
Revenue
$25.41B
EBITDA
$12.88B
Gross Margin
56.3%
Profit Margin
28.8%
Revenue Growth
11.5%
Total Cash
$2.11B
Total Debt
$31.17B
Free Cash Flow
$4.72B


52-Week Price Performance Analysis

Price Statistics
P/E Ratio
23.30
Forward P/E
20.19
Beta
0.95
52-Week High
$315.99
52-Week Low
$215.53
EPS
$12.34
50-Day Avg
$287.88
200-Day Avg
$266.82
Price/Book
8.26
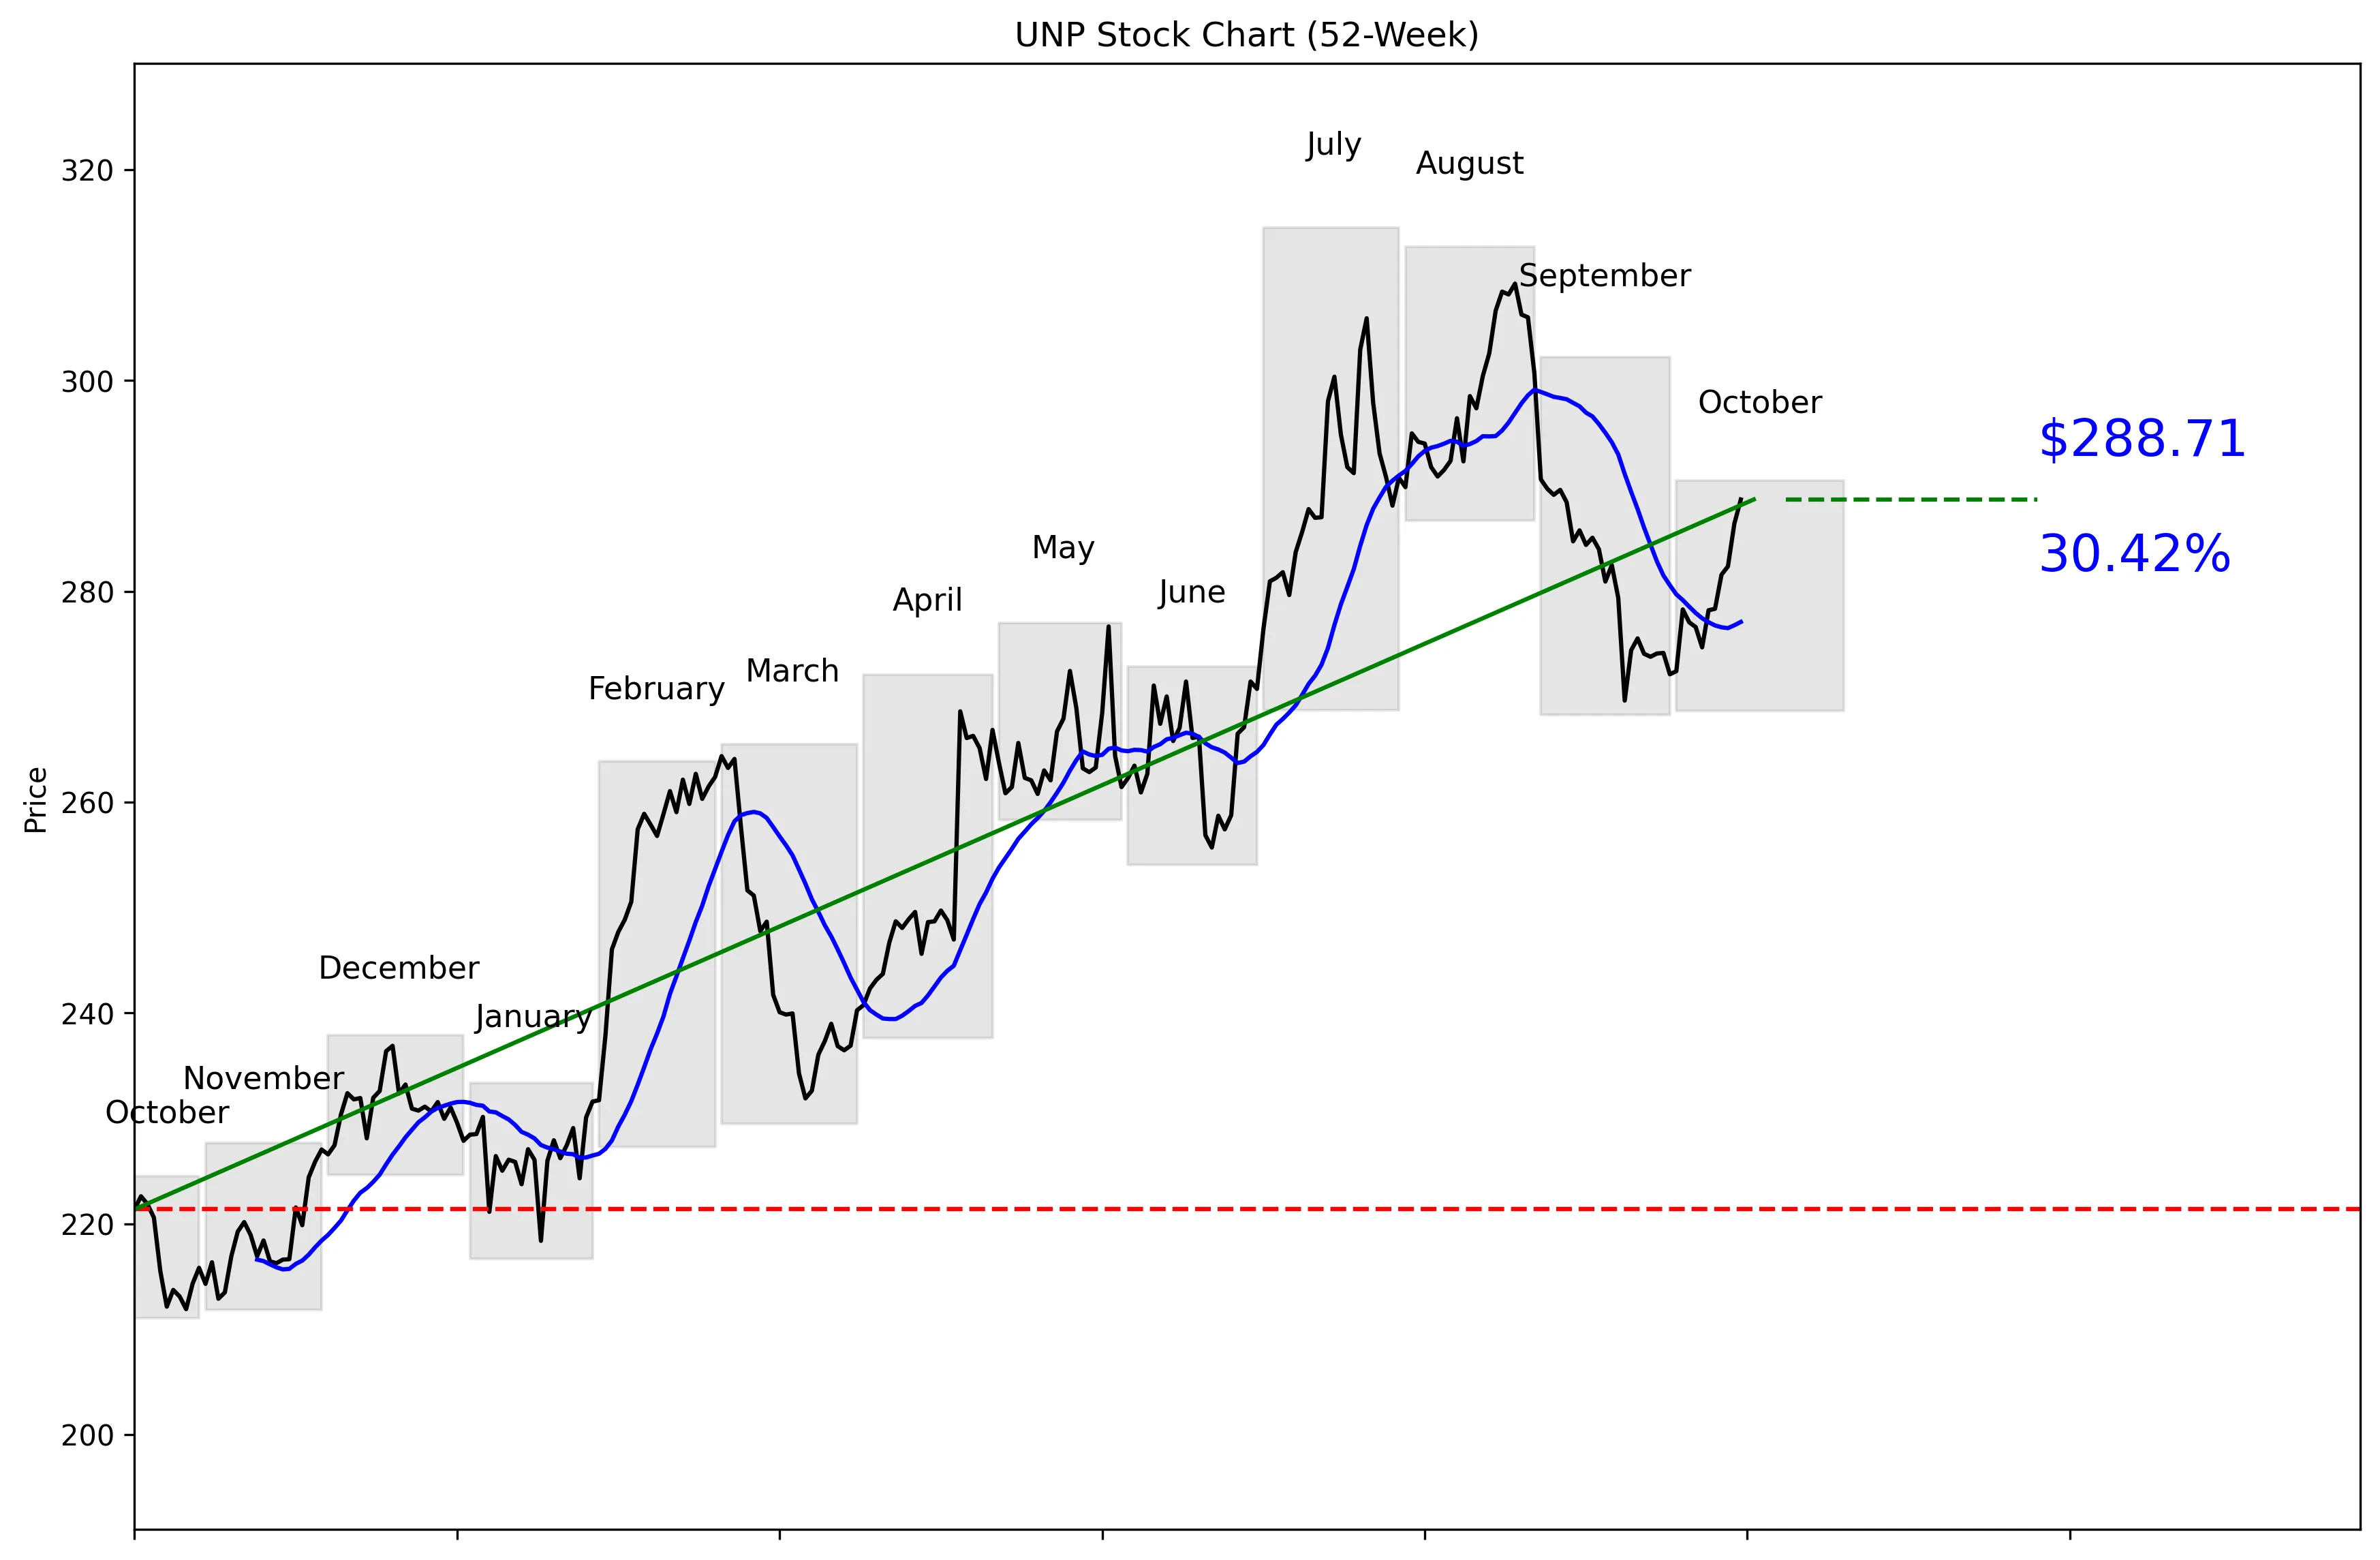
UNP 52-Week Stock Chart
Technical Analysis
UNP trades at $287.49, placing it 75% of the way from its $211.08 52-week low to its $314.53 high. The stock is 8.21% below that high and 36.78% above the low. Price sits 4.19% above the 20-day moving average of $277.09. Momentum is positive at 3.78% over five trading days and 2.21% over 20 trading days. Near-term support is $269.63, while $289.62 is the immediate resistance level.


Recent News and Developments

CFO Jennifer Hamann will retire in early 2027

Union Pacific said Jennifer Hamann will retire after nearly 35 years with the railroad, including service as CFO since January 2020. The company has not named a successor and said succession plans will come later. Source: Union Pacific

Raymond James cuts UNP price target to $350

Raymond James lowered its Union Pacific price target from $363 to $350 on October 15. That is a 3.58% reduction, but the target remains well above UNP’s October 16 closing price of $289.04. Source: Reuters via Charles Schwab

Union Pacific sets October 22 earnings release

Union Pacific will release third-quarter 2026 financial and operating results on October 22 at 7:45 a.m. ET. Management will hold its conference call and webcast one hour later. Source: Union Pacific


Market Sentiment and Analyst Recommendations

Bull Case
Revenue growth of 11.5% is the clearest reason to own UNP. The company generates $25.41 billion in revenue and carries a $170.79 billion market cap. Wall Street rates the stock a buy across 24 analysts, with a consensus target of $327.62. The high-end analyst target reaches $375.00, leaving room above the current $287.49 price. Union Pacific’s proposed Norfolk Southern combination includes $2 billion in additional investment over three years, alongside combined annual spending of $5.6 billion. Earnings on October 22 provide a near-term catalyst, and the positive five-day and 20-day momentum shows buyers are moving in ahead of that report.
Bear Case
UNP is not cheap at 23.30 times earnings. The stock is already 75% of the way through its 52-week range and only 8.21% below its high, so strong expectations are already reflected in the price. Total debt of $31.17 billion towers over $2.11 billion in cash. The proposed combination’s additional $2 billion investment creates execution and capital-allocation risk during the three-year integration period. CFO Jennifer Hamann will retire in early 2027, and no successor has been named. Analyst expectations also vary widely: the lowest target is $245.00, while Raymond James just reduced its target from $363 to $350.
What to Watch
Third-quarter 2026 results arrive October 22 at 7:45 a.m. ET, followed by management’s conference call and webcast one hour later. Revenue growth is the central operating metric because the current figure is 11.5%. Watch whether the stock can clear its $289.62 near-term resistance after closing at $289.04 on October 16. A move below the $277.09 20-day moving average would weaken the current technical setup, while $269.63 is the key near-term support level. Investors should also track details on the Norfolk Southern proposal, especially the planned $2 billion investment and three-year integration period. The CFO succession plan matters because Jennifer Hamann is retiring in early 2027 and Union Pacific has not named a replacement.
Analyst Consensus
BUY

Based on 24 analyst opinions
Low Target
$245.00
Mean Target
$327.62
High Target
$375.00


Earnings and Financial Data

Sector
Industrials
Industry
Railroads
Employees
28,716
Earnings & Dividends
Next Earnings
Oct 22, 2026
EPS (Trailing)
$12.34
Dividend Yield
197.0%
Payout Ratio
44.7%

Frequently Asked Questions

Is UNP a good stock to buy?
The recommendation is buy based on 24 analysts, and revenue growth is 11.5%. The takeaway is that the analyst view is positive, but the 23.30 P/E demands continued execution.
What is UNP’s price target?
The consensus analyst target is $327.62, with estimates ranging from $245.00 to $375.00. The takeaway is that analysts see upside overall, but their expectations vary substantially.
Is UNP near its 52-week high?
UNP is 8.21% below its $314.53 52-week high and sits 75% of the way from its $211.08 low to that high. The takeaway is that the stock is trading in the upper portion of its annual range.
What are UNP’s support and resistance levels?
Near-term support is the 30-day low of $269.63, while resistance is the 30-day high of $289.62. The takeaway is that $289.62 is the immediate level the stock needs to clear.
Does UNP pay a dividend?
The provided data does not include a dividend rate or dividend yield. The takeaway is that investors should verify the current dividend separately before making an income-based decision.

Related Stock Reports

Disclaimer: This report is for informational purposes only and does not constitute financial advice. The analysis and opinions expressed are those of AltStation.io and should not be relied upon as the sole basis for investment decisions. Always conduct your own research and consult with a qualified financial advisor before making investment decisions. Past performance does not guarantee future results. Updated October 16, 2026.