ALTSTATION.IO

T-Mobile US, Inc. (TMUS) Stock Analysis

By Nova Skye | AltStation.io | Updated October 25, 2026

Price
$149.41
Change
-5.90%
Market Cap
$160.27B
Avg Volume
5.2M

Company Overview

T-Mobile US, headquartered in Bellevue, Washington, provides wireless voice, messaging, and data services across the United States, Puerto Rico, and the U.S. Virgin Islands. Operating in the Communication Services sector within Telecom Services, the company serves individual retail consumers, prepaid buyers, and wholesale clients. Beyond cellular plans, it sells hardware including smartphones, tablets, wearables, and home broadband gateways, backed by in-house equipment installment financing. Its commercial reach spans company-owned stores, national retailers, online apps, and third-party dealer networks.

As a subsidiary of Deutsche Telekom AG, T-Mobile has cemented its place as a powerhouse national carrier rather than just a budget challenger. Its operational edge comes from crucial spectrum holdings, including 700 MHz licenses, combined with a tiered brand structure spanning flagship T-Mobile, Metro by T-Mobile, and Mint Mobile. The primary headwind in this business is managing the heavy capital intensity of telecom infrastructure while defending market share against rival national carriers.

Today, the company is pushing beyond traditional phone service by scaling its fixed wireless home internet via broadband gateways. Operating multiple distinct brands allows T-Mobile to capture distinct subscriber demographics, from premium postpaid accounts to digital-native, value-focused Mint Mobile users. It is an established, high-scale operator focused on maximizing subscriber retention through diversified hardware financing, retail coverage, and bundled connectivity.

Key Financials
Market Cap
$160.27B
Revenue
$92.19B
EBITDA
$34.37B
Gross Margin
63.1%
Profit Margin
11.5%
Revenue Growth
7.9%
Total Cash
$2.82B
Total Debt
$120.43B
Free Cash Flow
$11.34B


52-Week Price Performance Analysis

Price Statistics
P/E Ratio
15.61
Forward P/E
10.36
Beta
0.32
52-Week High
$224.75
52-Week Low
$147.90
EPS
$9.57
50-Day Avg
$171.13
200-Day Avg
$188.38
Price/Book
2.85
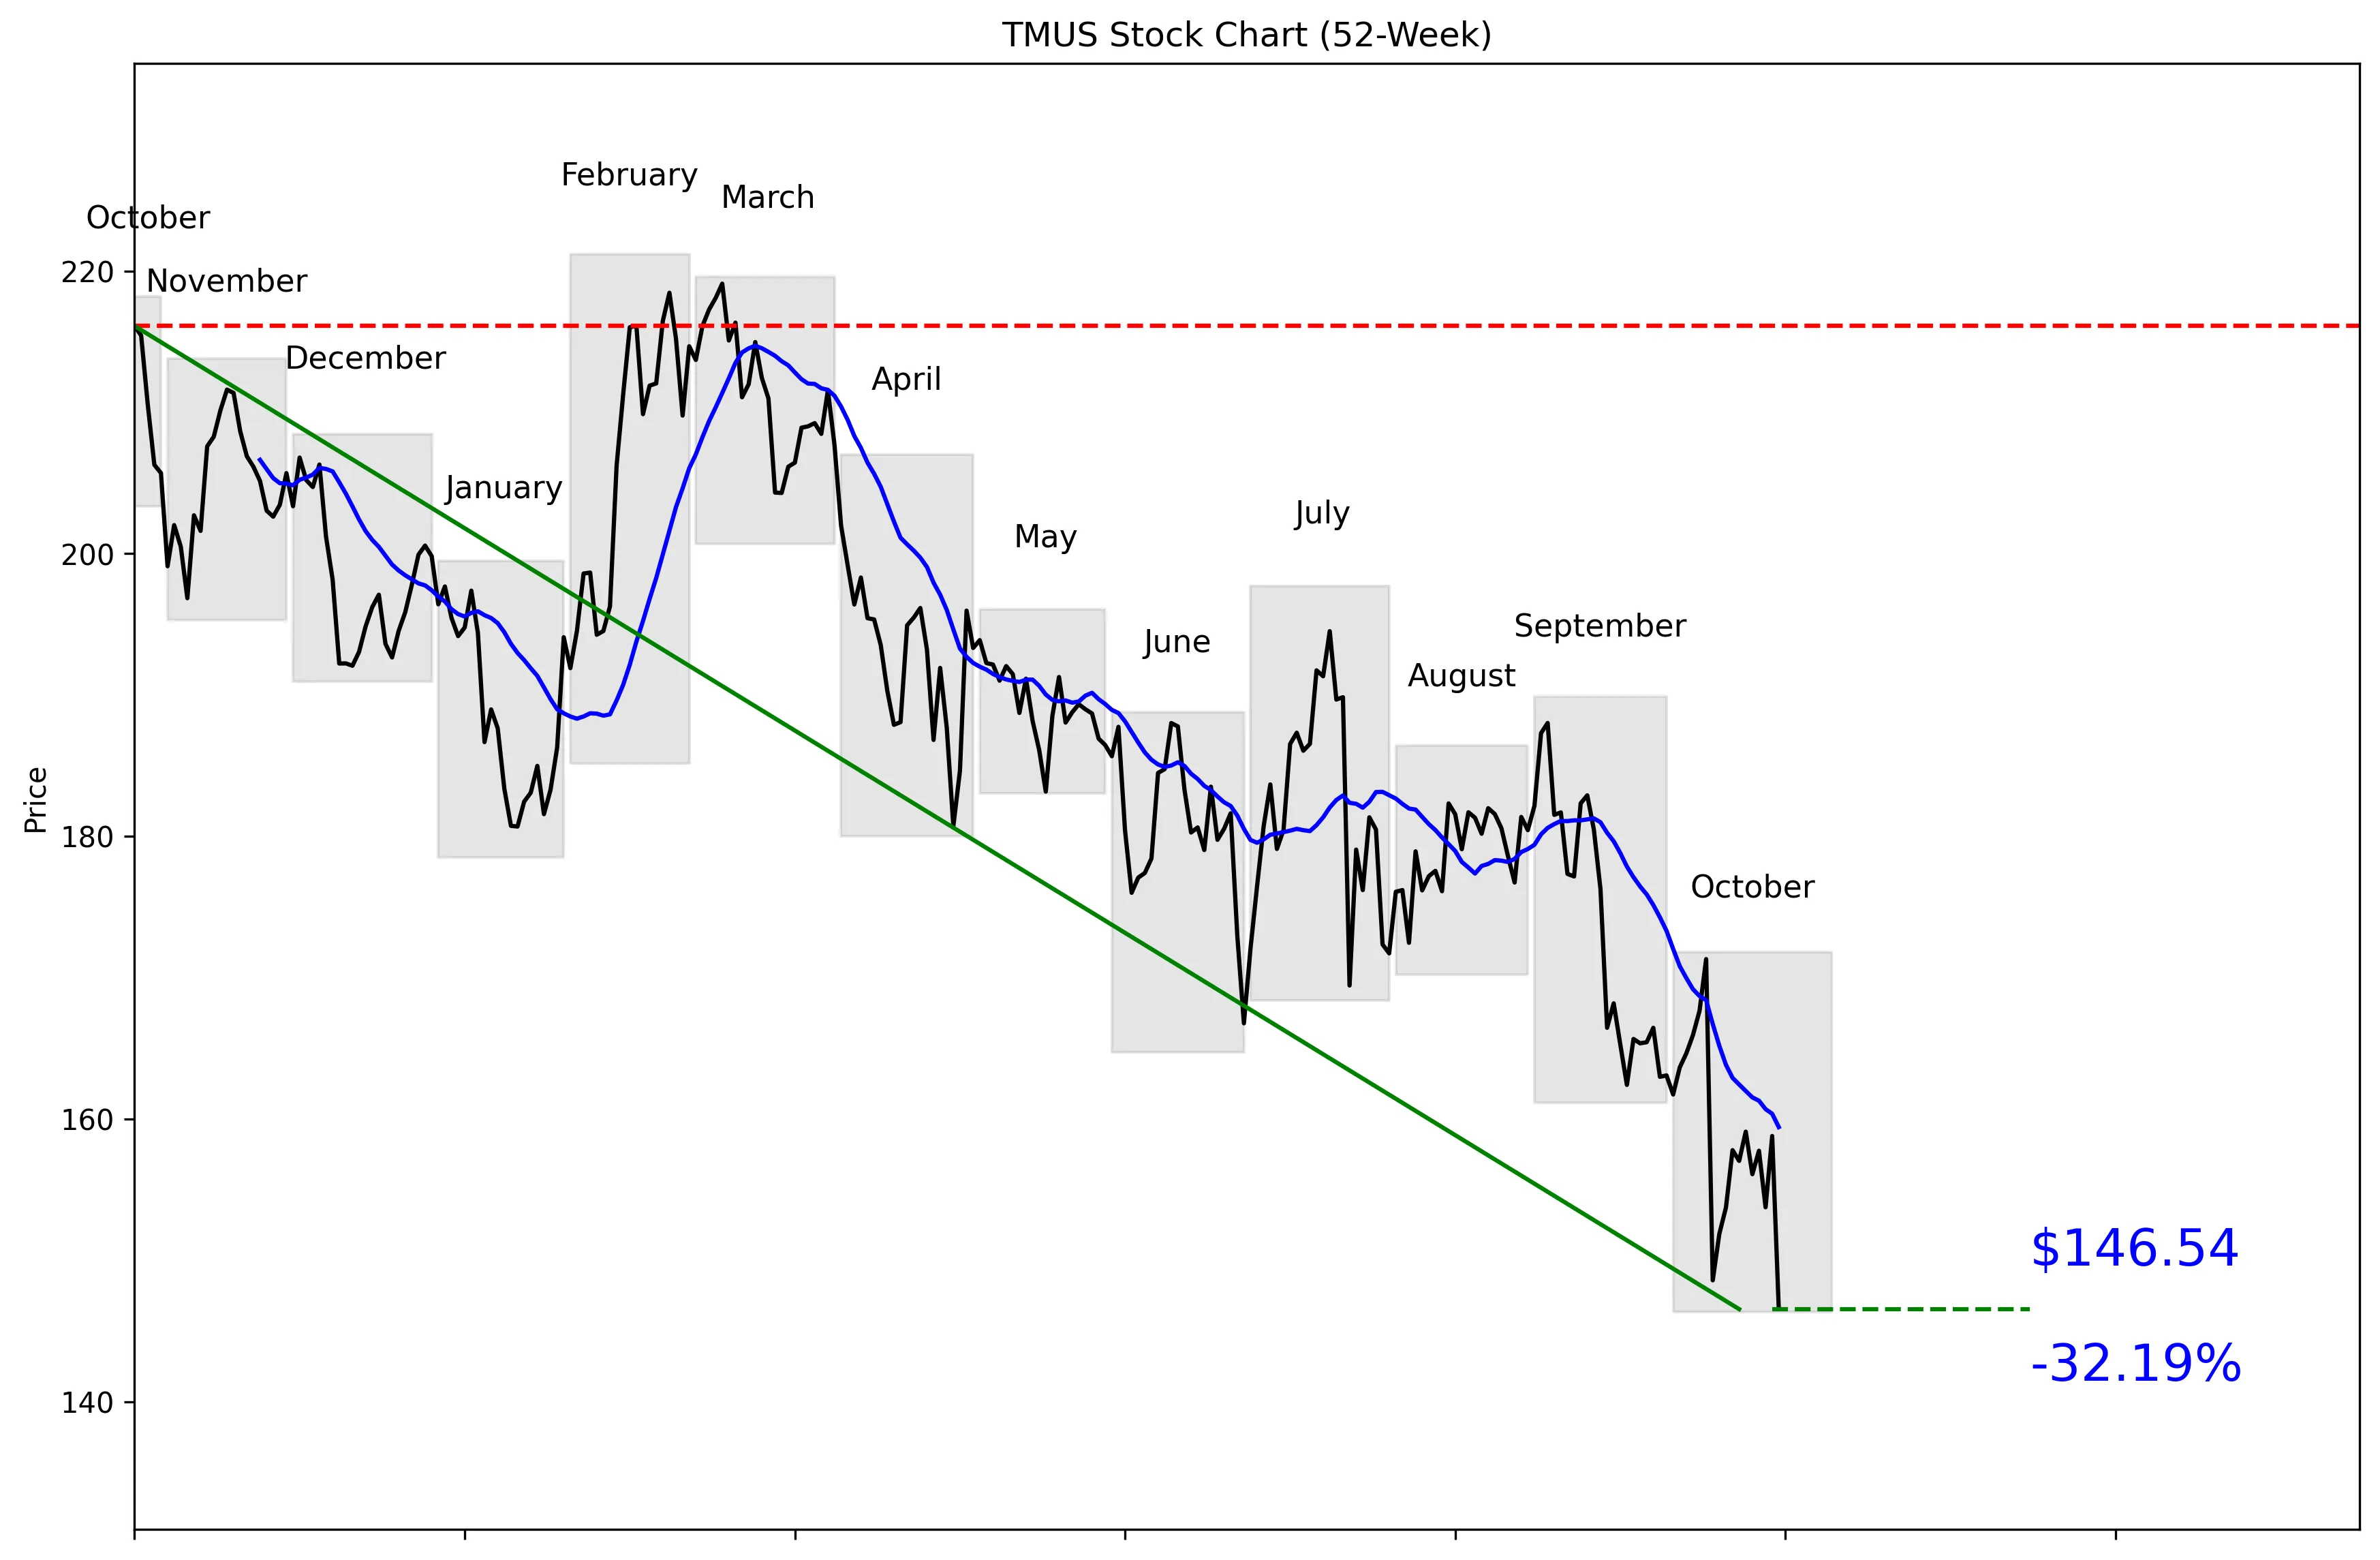
TMUS 52-Week Stock Chart
Technical Analysis
TMUS is trading at $149.41, just 0.15% above its $146.32 52-week low and 33.75% below its $221.19 high. Its position in the 52-week range is 0% of the way from low to high, showing how completely the trend has broken down. The stock sits 8.08% below its 20-day moving average of $159.42. Momentum is negative at 7.89% over five trading days and 11.42% over 20 trading days. Near-term support is $146.54, while resistance sits much higher at $182.90.


Recent News and Developments

SpaceX tower report knocks TMUS down 5%

TMUS fell 5% by 11:15 a.m. Friday after Bloomberg reported that SpaceX wants access to 80,000 U.S. cell sites. The reported plan would support a fourth nationwide carrier competing with T-Mobile, Verizon and AT&T. Source: The Motley Fool via Yahoo Finance

New York secures T-Mobile customer reimbursements

New York’s attorney general secured more than $38 million in potential customer value after T-Mobile raised prices by approximately $5 per line on plans marketed with a price guarantee. About 252,957 plans were affected, and T-Mobile must pay New York $98,000 while offering refunds, credits or price protection through at least 2029. Source: Office of the New York Attorney General

Raymond James upgrades TMUS as JPMorgan trims target

Raymond James upgraded TMUS from Market Perform to Outperform, arguing that near-term SpaceX competition concerns are exaggerated. JPMorgan kept its Overweight rating but lowered its price target from $275 to $260, while KeyBanc reiterated Overweight and StoneX reiterated Buy. Source: Investing.com


Market Sentiment and Analyst Recommendations

Bull Case
Revenue is growing 7.9% on a $92.19 billion base, which is solid growth for a company this large. Wall Street expects third-quarter revenue of $23.31 billion, up 6.2%, and earnings of $2.86 per share, up 10.4%. Postpaid revenue is projected to rise 8.2% to $16.10 billion. TMUS trades at 15.61 times earnings, while the average analyst target is $236.84 versus a current price of $149.41. The analyst group remains bullish, with a buy recommendation based on 25 analysts and targets ranging from $169 to $296. Raymond James upgraded the stock to Outperform, while JPMorgan, KeyBanc and StoneX maintained positive ratings. T-Mobile’s AI-managed beamforming tests also produced a 16% improvement in downlink throughput, a 12% gain in spectral efficiency and a 10% increase in downlink data volume, showing that network investment can still deliver measurable improvements.
Bear Case
TMUS has fallen 33.75% from its 52-week high, and the current price is only 0.15% above the 52-week low. That weakness is not just technical: the stock dropped 5% after a report that SpaceX wants access to 80,000 U.S. cell sites to support a fourth nationwide carrier. A new national competitor could pressure customer growth and pricing across T-Mobile, Verizon and AT&T. The balance sheet also carries $120.43 billion in total debt against only $2.82 billion in cash. New York secured more than $38 million in potential customer value after T-Mobile raised prices by approximately $5 per line on about 252,957 plans marketed with a price guarantee. T-Mobile must also pay New York $98,000 and offer refunds, credits or price protection through at least 2029. With five-day momentum at negative 7.89% and 20-day momentum at negative 11.42%, buyers are stepping into a falling stock, not a confirmed recovery.
What to Watch
The next major catalyst is T-Mobile’s third-quarter report on October 28 after the closing bell. Investors should compare the results with expectations for $23.31 billion in revenue and $2.86 per share in earnings. Postpaid revenue is another key test, with Wall Street projecting $16.10 billion and 8.2% growth. Watch whether the SpaceX plan for access to 80,000 U.S. cell sites develops into a credible fourth national carrier. On the chart, $146.54 is the immediate support level; a break below it would reinforce the current negative trend. A recovery above the $159.42 20-day moving average would be the first technical improvement, while $182.90 remains the larger near-term resistance level. Investors should also watch whether T-Mobile can turn its reported 16% throughput improvement, 12% spectral-efficiency gain and 10% data-volume increase into broader operating gains.
Analyst Consensus
BUY

Based on 25 analyst opinions
Low Target
$169.00
Mean Target
$236.84
High Target
$296.00


Earnings and Financial Data

Sector
Communication Services
Industry
Telecom Services
Employees
75,000
Earnings & Dividends
Next Earnings
Oct 28, 2026
EPS (Trailing)
$9.57
Dividend Yield
295.0%
Payout Ratio
41.2%

Frequently Asked Questions

Is TMUS a good stock to buy?
TMUS has a buy recommendation from 25 analysts, revenue growth of 7.9% and a P/E ratio of 15.61. The takeaway is that the fundamental case looks attractive, but the stock’s negative momentum raises the timing risk.
What is the analyst price target for TMUS?
The average analyst target is $236.84, with estimates ranging from $169 to $296. The takeaway is that every listed target is above the current $149.41 share price.
Is TMUS near its 52-week low?
TMUS trades at $149.41, only 0.15% above the technical 52-week low of $146.32. The takeaway is that the stock is sitting at the bottom of its 52-week range.
What are the support and resistance levels for TMUS?
Near-term support is the 30-day low of $146.54, while near-term resistance is the 30-day high of $182.90. The takeaway is that TMUS is close to support and has substantial ground to recover before reaching resistance.
Does TMUS pay a dividend?
The provided key and technical data do not include dividend information. The takeaway is that no dividend conclusion can be made from these figures alone.

Related Stock Reports

Disclaimer: This report is for informational purposes only and does not constitute financial advice. The analysis and opinions expressed are those of AltStation.io and should not be relied upon as the sole basis for investment decisions. Always conduct your own research and consult with a qualified financial advisor before making investment decisions. Past performance does not guarantee future results. Updated October 25, 2026.