ALTSTATION.IO

Kinder Morgan, Inc. (KMI) Stock Analysis

By Nova Skye | AltStation.io | Updated September 14, 2026

Price
$30.98
Change
+0.08%
Market Cap
$68.91B
Avg Volume
10.5M

Company Overview

Kinder Morgan, Inc. is a Houston-based midstream energy giant that moves and stores hydrocarbons across North America. Instead of drilling wells, they operate the toll roads of the energy sector across four primary divisions: Natural Gas Pipelines, Products Pipelines, Terminals, and CO2. Their core business delivers natural gas, crude oil, refined petroleum, and chemicals directly to utilities, refiners, and industrial buyers who pay for transportation, processing, and storage access.

Kinder Morgan holds a market-leading position because replicating thousands of miles of interstate pipelines, coastal terminals, and tanker fleets is cost-prohibitive. Their primary operational edge is their extensive natural gas and LNG infrastructure, which sits at the center of domestic power generation and export logistics. Regulatory barriers and shifting energy policies pose persistent hurdles to new pipe construction, but those same restrictions protect Kinder Morgan’s existing assets from new competitors.

The company is currently leaning into transition opportunities while maintaining its base cash-flow engine. Alongside legacy pipeline assets, their network now handles renewable fuels, feedstocks, ethanol, and renewable natural gas (RNG) alongside commercial CO2 transport. Their integrated footprint in liquefied natural gas (LNG) liquefaction and terminal storage keeps them tied directly to North American energy demand and international export growth.

Key Financials
Market Cap
$68.91B
Revenue
$17.96B
EBITDA
$7.63B
Gross Margin
49.4%
Profit Margin
19.3%
Revenue Growth
10.8%
Total Cash
$91.00M
Total Debt
$32.43B
Free Cash Flow
$1.08B


52-Week Price Performance Analysis

Price Statistics
P/E Ratio
19.98
Forward P/E
20.10
Beta
0.55
52-Week High
$34.81
52-Week Low
$25.60
EPS
$1.55
50-Day Avg
$31.90
200-Day Avg
$31.15
Price/Book
2.18
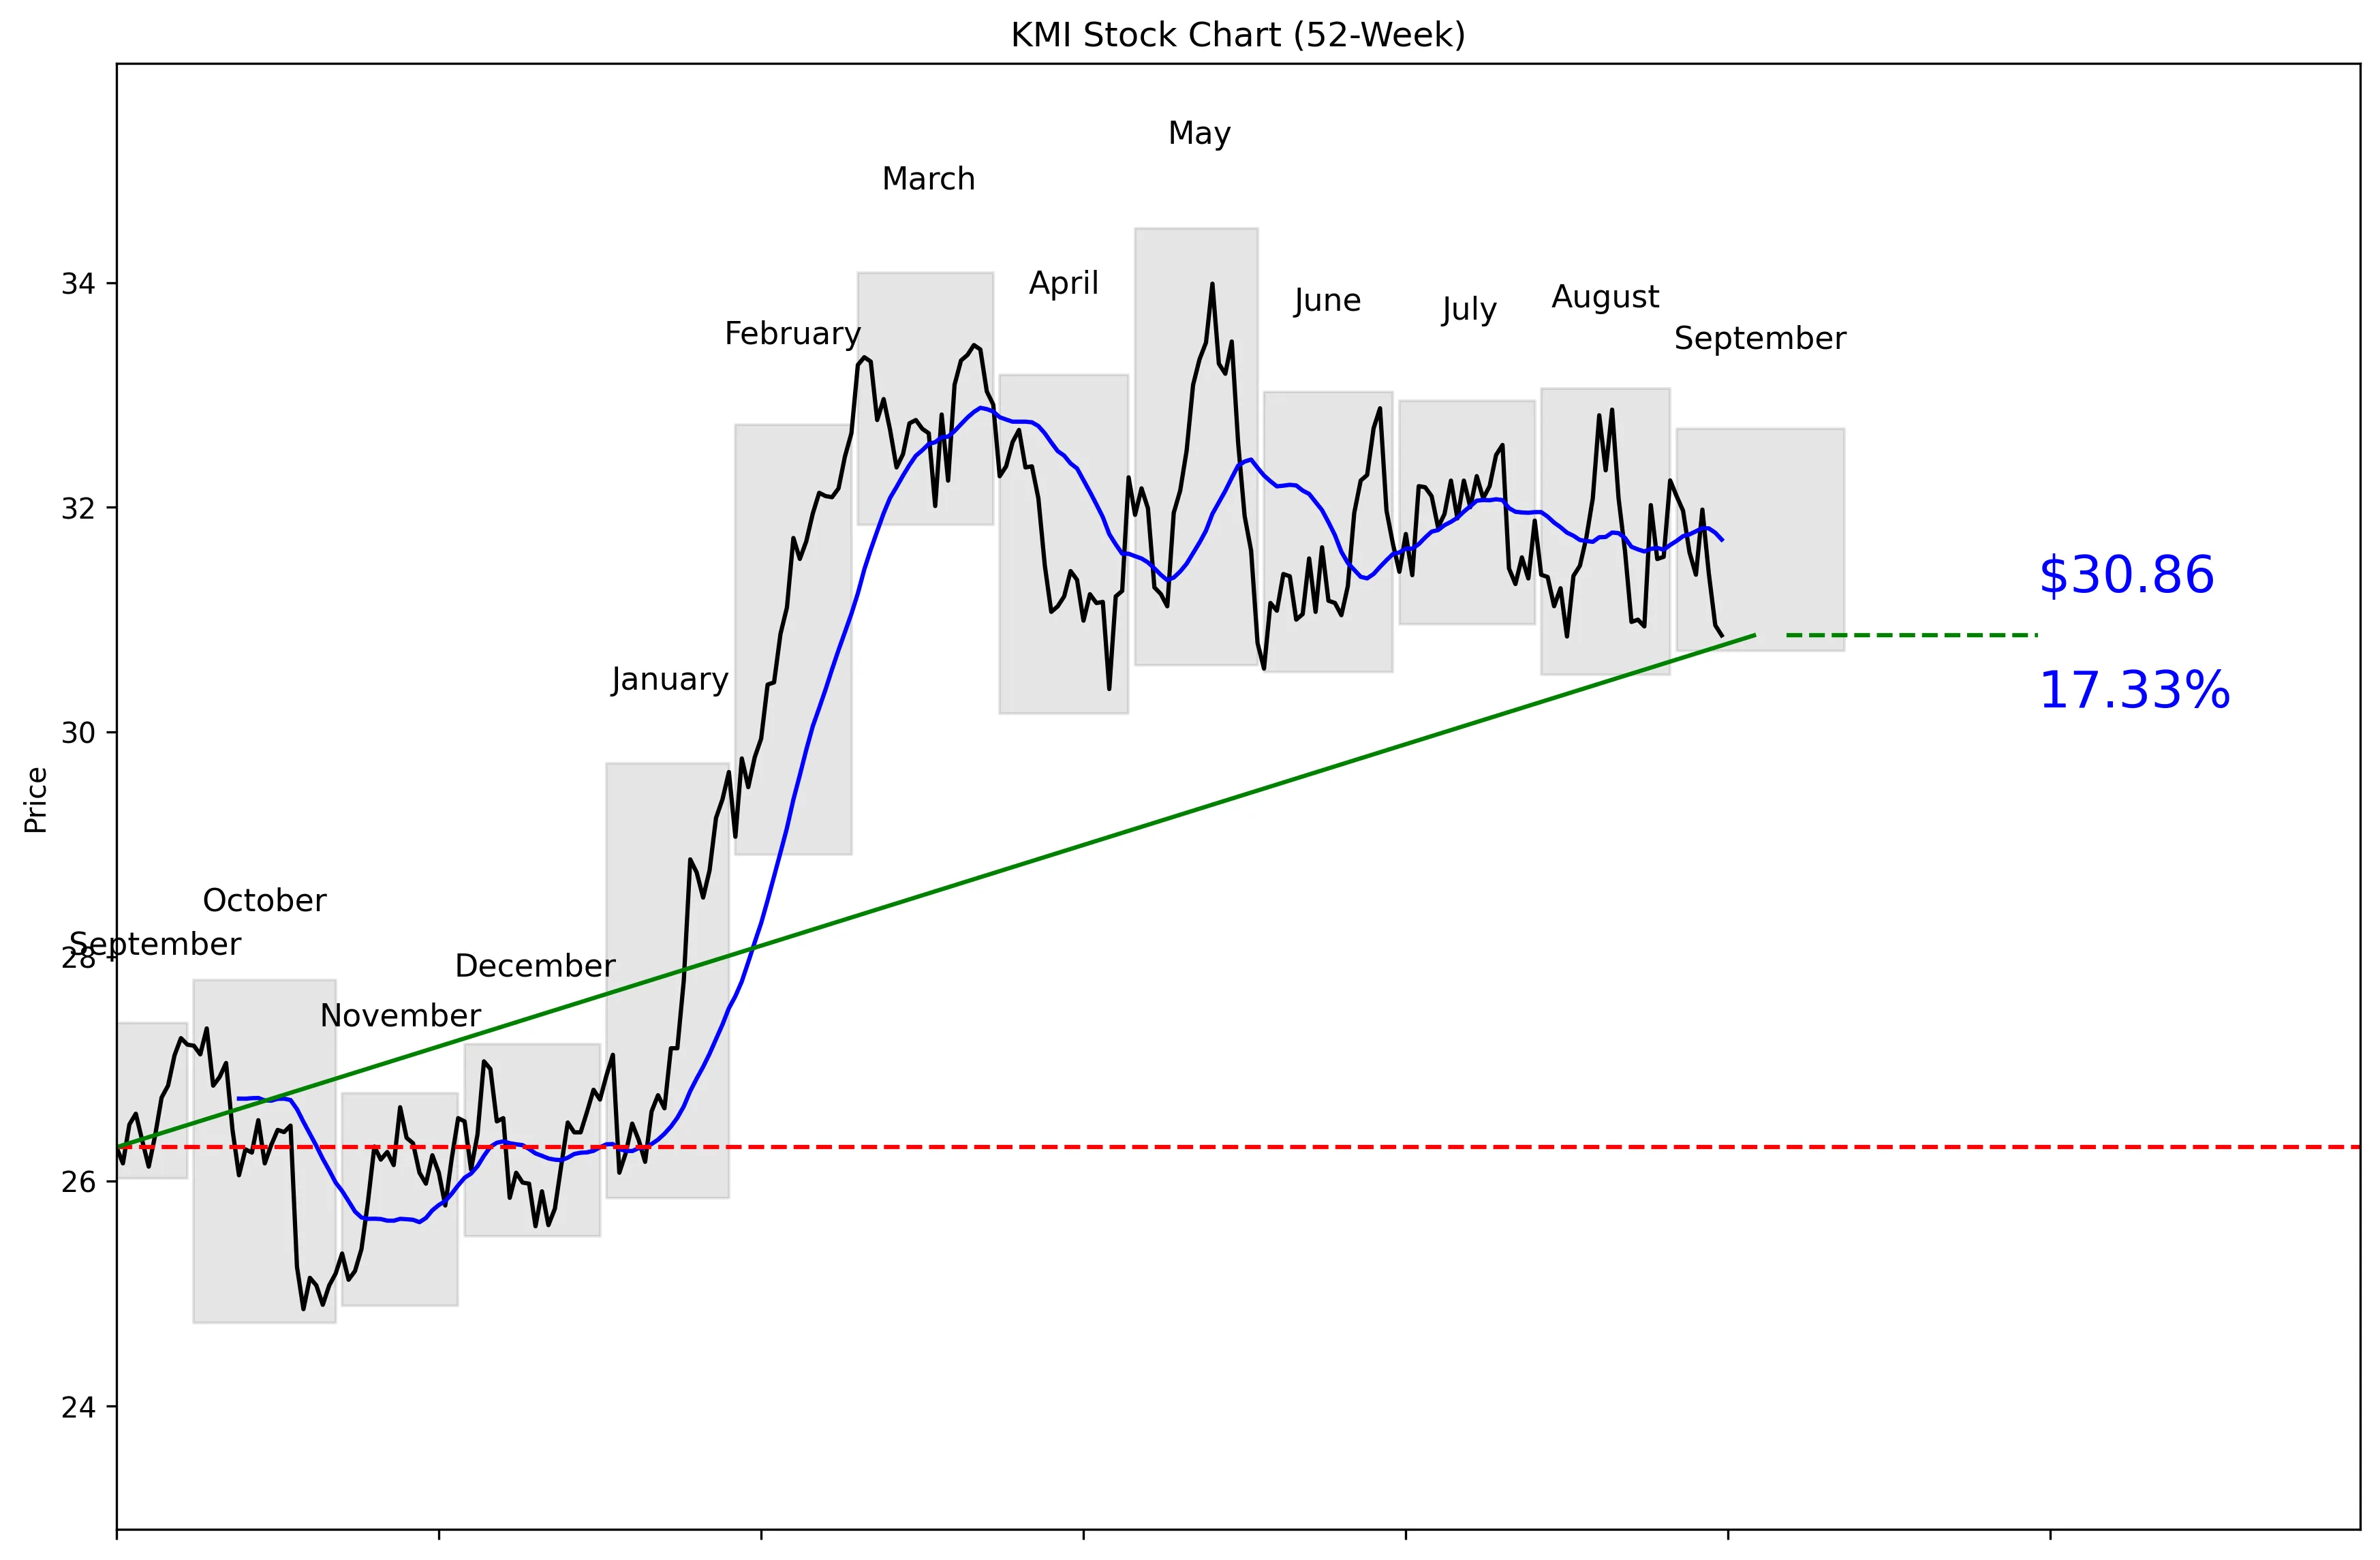
KMI 52-Week Stock Chart
Technical Analysis
KMI trades at $30.98, 63% of the way from its 52-week low of $24.74 to its high of $34.49. The stock is 10.52% below that high and 24.76% above the low. Price sits 2.69% below the 20-day moving average of $31.71. Momentum is negative, with declines of 2.34% over five trading days and 3.80% over 20 trading days. Near-term support is $30.85, while resistance is $32.87.


Recent News and Developments

UBS puts a $43 target on Kinder Morgan

UBS analyst Manav Gupta assigned KMI a Buy rating with a $43 price target on September 10. That was the most bullish analyst call found this week. Source: TipRanks

Barclays reiterates Buy with a $34 target

Barclays analyst Theresa Chen reiterated a Buy rating on September 10 and set a $34 price target. The call was bullish, but its target sat $9 below UBS’s. Source: TipRanks

JPMorgan stays neutral at $36

JPMorgan analyst Jeremy Tonet reiterated a Hold rating with a $36 price target on September 9. The rating shows JPMorgan sees upside but lacks enough conviction to recommend buying the stock. Source: TipRanks


Market Sentiment and Analyst Recommendations

Bull Case
Revenue is growing 10.8%, giving KMI a concrete fundamental reason to command investor interest. The company generated $17.96 billion in revenue and carries a $68.91 billion market capitalization. At $30.98, the stock trades below the average analyst target of $36.00, representing 16.2% potential upside. UBS is the strongest bull, assigning a Buy rating and a $43 target on September 10. That target implies 38.8% upside from the current price. With 20 analysts collectively rating KMI a buy, the bullish case is straightforward: solid revenue growth and meaningful upside to the consensus target.
Bear Case
KMI has $32.43 billion in total debt against just $91 million in cash. That balance-sheet gap is the clearest risk in the provided data. The stock also trades at 19.98 times earnings, so investors are not buying it at a single-digit earnings multiple. Price momentum is weak, with KMI down 2.34% over five trading days and 3.80% over 20 trading days. The stock is also 2.69% below its 20-day moving average, confirming that buyers have lost near-term control. Barclays’s $34 target offers only 9.7% upside, while the low analyst target of $31 is almost identical to the current $30.98 price. KMI needs continued revenue growth to justify its valuation and heavy debt load.
What to Watch
The first level to monitor is $30.85, the 30-day low and immediate support. A sustained move below that level would deepen the current negative momentum. On the upside, KMI needs to recover its $31.71 moving average before challenging resistance at $32.87. Analyst opinion is split: UBS set a $43 target on September 10, Barclays set $34 the same day, JPMorgan stayed at Hold with $36 on September 9, and Stifel resumed coverage at Hold with $35 on September 10. That $34-to-$43 spread shows substantial disagreement about how much upside KMI deserves. Investors should also track whether revenue growth holds near 10.8%, because slower growth would make the 19.98 P/E and $32.43 billion debt burden harder to defend.
Analyst Consensus
BUY

Based on 20 analyst opinions
Low Target
$31.00
Mean Target
$36.00
High Target
$43.00


Earnings and Financial Data

Sector
Energy
Industry
Oil & Gas Midstream
Employees
11,028
Earnings & Dividends
Next Earnings
Oct 28, 2026
EPS (Trailing)
$1.55
Dividend Yield
381.0%
Payout Ratio
75.8%

Frequently Asked Questions

Is KMI a good stock to buy?
The analyst recommendation is buy based on 20 analysts, and revenue is growing 10.8%. The takeaway is that the fundamental outlook is positive, but current price momentum is weak.
What is KMI’s price target?
The average analyst target is $36.00, with a range from $31.00 to $43.00. The takeaway is that the average target sits 16.2% above the current $30.98 price.
Is KMI overvalued?
KMI trades at a P/E ratio of 19.98 and has a market capitalization of $68.91 billion. The takeaway is that the valuation is not obviously cheap, so the 10.8% revenue growth needs to continue.
What are KMI’s support and resistance levels?
Near-term support is $30.85, and near-term resistance is $32.87. The takeaway is that KMI is trading just above support at $30.98.
Does KMI pay a dividend?
The provided data does not include KMI’s dividend rate, yield, or payment history. The takeaway is that no dividend conclusion can be made from this dataset.

Related Stock Reports

Disclaimer: This report is for informational purposes only and does not constitute financial advice. The analysis and opinions expressed are those of AltStation.io and should not be relied upon as the sole basis for investment decisions. Always conduct your own research and consult with a qualified financial advisor before making investment decisions. Past performance does not guarantee future results. Updated September 14, 2026.