ALTSTATION.IO

The Williams Companies, Inc. (WMB) Stock Analysis

By Nova Skye | AltStation.io | Updated September 19, 2026

Price
$71.37
Change
-0.81%
Market Cap
$87.30B
Avg Volume
7.4M

Company Overview

The Williams Companies is an oil and gas midstream provider headquartered in Tulsa, Oklahoma, that operates critical energy infrastructure across the United States. Founded in 1908, the company runs approximately 32,000 miles of pipelines, handling interstate natural gas transportation, gathering, processing, and storage. They sell wholesale gas marketing, trading, and natural gas liquids fractionation to utilities, municipalities, power generators, and energy producers. In practical terms, Williams operates as a toll road connecting major American gas basins directly to high-volume power consumers.

Williams holds a dominant market-leader position in domestic gas transmission anchored by major interstate assets like the Transco, NWP, and Mountain West pipeline systems. Their primary advantage is deep geographic integration across top-tier production regions, including the Marcellus, Utica, Haynesville, and Permian basins. Midstream infrastructure faces real challenges from regional volume shifts and strict corridor oversight, but Williams buffers this risk by controlling assets across both gathering basins and coastal delivery points. They control key infrastructure between the wellhead and high-demand commercial markets.

The company operates across five core segments: Transmission, Power and Gulf, Northeast G&P, West, and Gas and NGL Marketing Services. Williams links major natural gas production in states like Pennsylvania, Ohio, and Texas directly to storage and fractionation hubs like Conway, Kansas, alongside crude handling assets in the Gulf Coast. This setup gives the business direct operational scale across supply basins, downstream utility demand, and commodity trading. Williams stands as a massive, scaled midstream operator locked into domestic natural gas and natural gas liquids delivery.

Key Financials
Market Cap
$87.30B
Revenue
$12.32B
EBITDA
$7.03B
Gross Margin
63.6%
Profit Margin
24.9%
Revenue Growth
7.8%
Total Cash
$203.00M
Total Debt
$30.79B
Free Cash Flow
-$1.52B


52-Week Price Performance Analysis

Price Statistics
P/E Ratio
28.43
Forward P/E
27.48
Beta
0.62
52-Week High
$80.08
52-Week Low
$56.19
EPS
$2.51
50-Day Avg
$73.28
200-Day Avg
$70.51
Price/Book
6.64
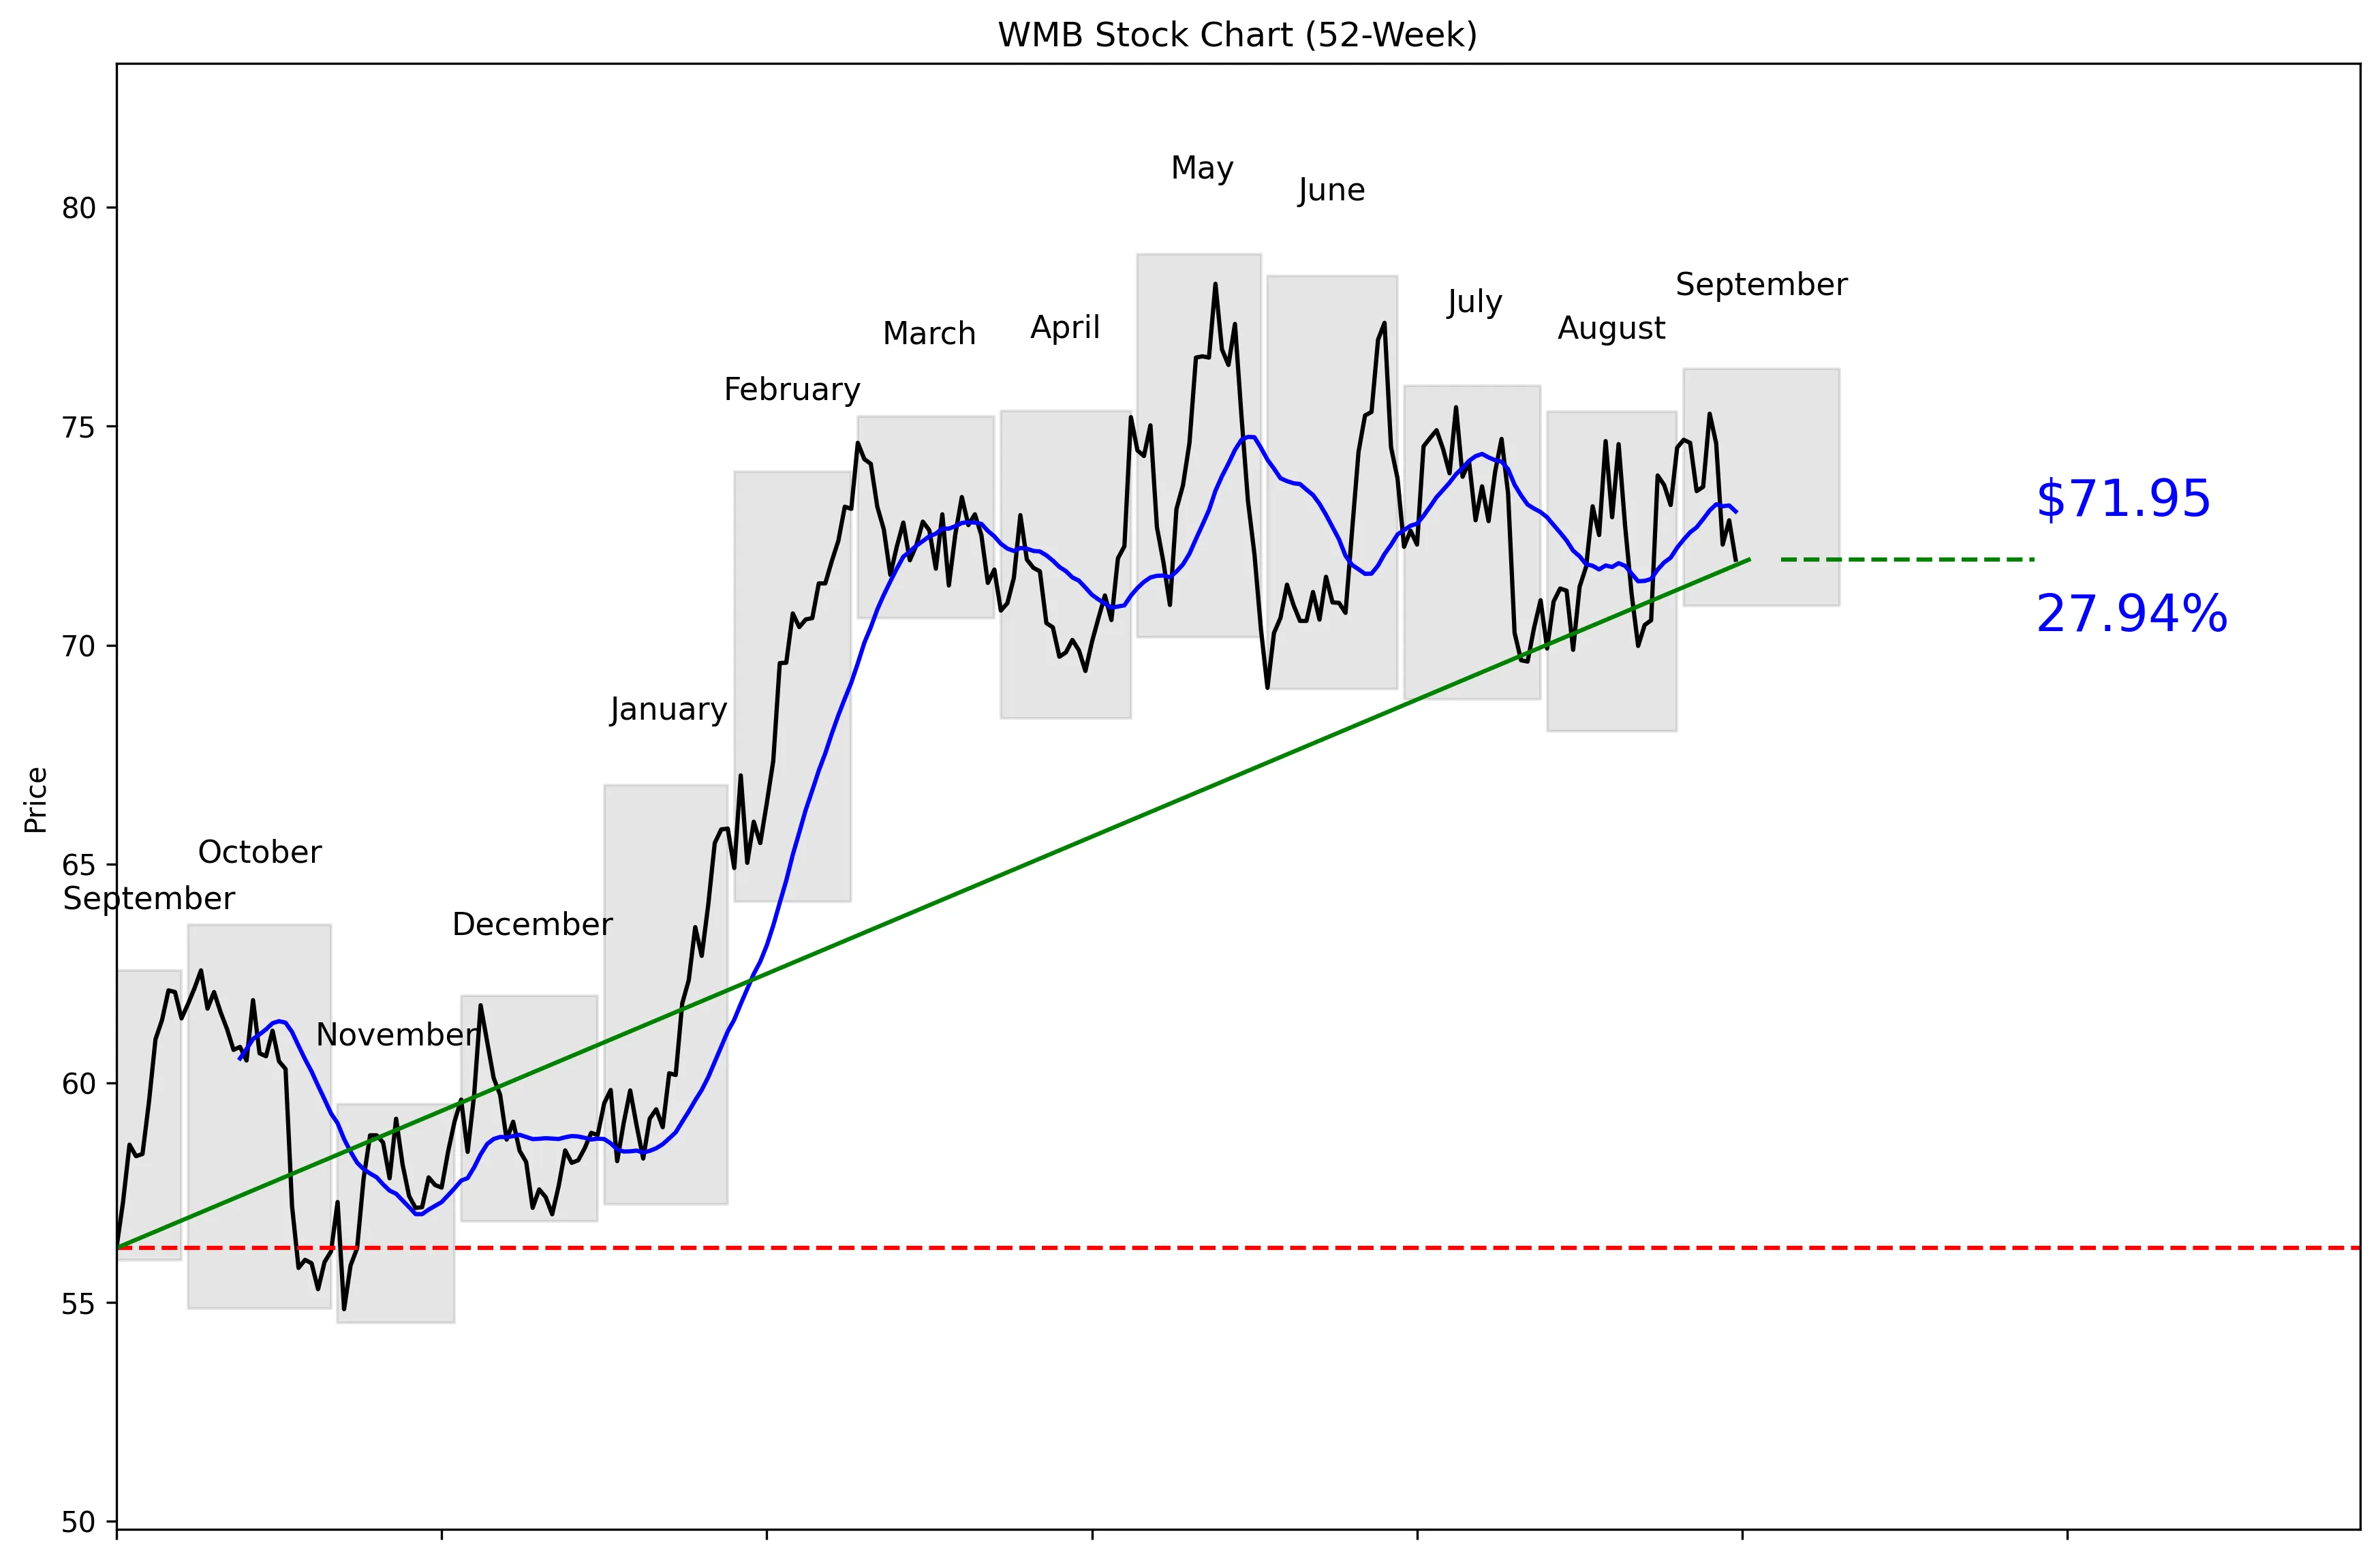
WMB 52-Week Stock Chart
Technical Analysis
WMB trades at $71.37, 71% of the way from its $54.53 52-week low to its $78.92 high. The stock is 8.83% below that high and 31.95% above the low. Price sits 1.51% below the 20-day moving average of $73.05. Momentum is negative, with declines of 2.26% over five trading days and 3.63% over 20 trading days. Near-term support is $69.89, while resistance is $75.28.


Recent News and Developments

Williams prices $2.75 billion senior-note offering

Williams priced four debt tranches carrying rates from 5.000% to 6.400% and maturities from 2029 to 2056. The company said proceeds will repay commercial paper and fund general corporate purposes, including capital expenditures. Source: Williams Companies

Stifel reinstates WMB at Buy with an $85 target

Stifel reinstated coverage of Williams Companies with a Buy rating and an $85 price target on September 10. WMB closed that session at $72.93, putting the target 16.6% above the closing price. Source: TheStreet Pro

Scotiabank trims WMB target but stays bullish

Scotiabank maintained its Sector Outperform rating on Williams Companies while cutting its price target from $86 to $85 on September 10. That is a minor target reduction, not a downgrade. Source: Benzinga


Market Sentiment and Analyst Recommendations

Bull Case
Revenue is growing 7.8%, giving Williams a solid fundamental base. The company generated $12.32 billion in revenue and carries an $87.30 billion market cap. Wall Street’s consensus recommendation is strong buy across 21 analysts. The average target is $85.38, with estimates reaching as high as $103.00. Stifel reinstated coverage at Buy with an $85 target on September 10, while Scotiabank maintained its Sector Outperform rating with the same target. The bull case is straightforward: continued revenue growth and a move through $75.28 resistance would strengthen the case for buying WMB at $71.37.
Bear Case
WMB’s 28.43 P/E leaves limited room for disappointing growth or execution. Revenue growth of 7.8% is positive, but investors are paying a substantial multiple for it. The balance sheet carries $30.79 billion in total debt against only $203.00 million in cash. Williams also priced another $2.75 billion of senior notes with rates between 5.000% and 6.400%, reinforcing the importance of its financing costs. Price momentum has weakened, including a 5.5% decline from the September 8 close through September 15 and a 3.63% decline over the latest 20 trading days. Competitive and broader macro risks were not provided, but the documented valuation, debt load, financing rates, and weakening price trend are enough to make chasing the stock unattractive.
What to Watch
The first technical test is whether WMB holds the $69.89 near-term support level. A break above $75.28 resistance would improve the short-term setup, while failure to regain the $73.05 20-day moving average would keep momentum weak. Investors should track whether revenue growth stays near or above the current 7.8% rate in the next reported period. Williams’ use of the $2.75 billion note proceeds also matters because the company plans to repay commercial paper and fund general corporate purposes, including capital expenditures. Watch total debt of $30.79 billion and cash of $203.00 million for evidence that the financing improves or worsens the balance-sheet position. No next-quarter earnings date was provided, so the thesis should be judged against the known thresholds: $69.89 support, $75.28 resistance, $73.05 moving average, and the $85.38 consensus target.
Analyst Consensus
STRONG BUY

Based on 21 analyst opinions
Low Target
$69.00
Mean Target
$85.38
High Target
$103.00


Earnings and Financial Data

Sector
Energy
Industry
Oil & Gas Midstream
Employees
5,987
Earnings & Dividends
Next Earnings
Nov 02, 2026
EPS (Trailing)
$2.51
Dividend Yield
292.0%
Payout Ratio
81.7%

Frequently Asked Questions

Is WMB a good stock to buy?
WMB has a strong-buy recommendation from 21 analysts, revenue growth of 7.8%, and an average analyst target of $85.38. The takeaway is that Wall Street is bullish, but the 28.43 P/E and $30.79 billion debt load demand discipline.
What is WMB’s price target?
The average analyst target is $85.38, with a range from $69.00 to $103.00. The takeaway is that analyst expectations vary widely despite the strong-buy consensus.
What are WMB’s key support and resistance levels?
Near-term support is $69.89, and near-term resistance is $75.28. The takeaway is that these are the primary levels to watch around the current $71.37 price.
How is WMB stock performing technically?
WMB is 1.51% below its $73.05 20-day moving average, with momentum of negative 2.26% over five trading days and negative 3.63% over 20 trading days. The takeaway is that the near-term trend is weak.
Does WMB pay a dividend?
Dividend data was not included in the provided key or technical data. The takeaway is that no dividend conclusion can be made from this dataset.

Related Stock Reports

Disclaimer: This report is for informational purposes only and does not constitute financial advice. The analysis and opinions expressed are those of AltStation.io and should not be relied upon as the sole basis for investment decisions. Always conduct your own research and consult with a qualified financial advisor before making investment decisions. Past performance does not guarantee future results. Updated September 19, 2026.