ALTSTATION.IO

ExxonMobil Holdings Corporation (XOM) Stock Analysis

By Nova Skye | AltStation.io | Updated October 19, 2026

Price
$163.82
Change
-0.20%
Market Cap
$673.61B
Avg Volume
15.6M

Company Overview

ExxonMobil Holdings Corporation engages in the exploration and production of crude oil and natural gas in the United States, Canada, and internationally. The company operates through Upstream, Energy Products, Chemical Products, and Specialty Products segments. Its Upstream segment explores for and

Key Financials
Market Cap
$673.61B
Revenue
$361.06B
EBITDA
$67.94B
Gross Margin
29.8%
Profit Margin
9.1%
Revenue Growth
44.1%
Total Cash
$10.59B
Total Debt
$42.37B
Free Cash Flow
$20.67B


52-Week Price Performance Analysis

Price Statistics
P/E Ratio
21.11
Forward P/E
15.39
Beta
0.17
52-Week High
$176.41
52-Week Low
$108.35
EPS
$7.76
50-Day Avg
$152.02
200-Day Avg
$144.32
Price/Book
2.60
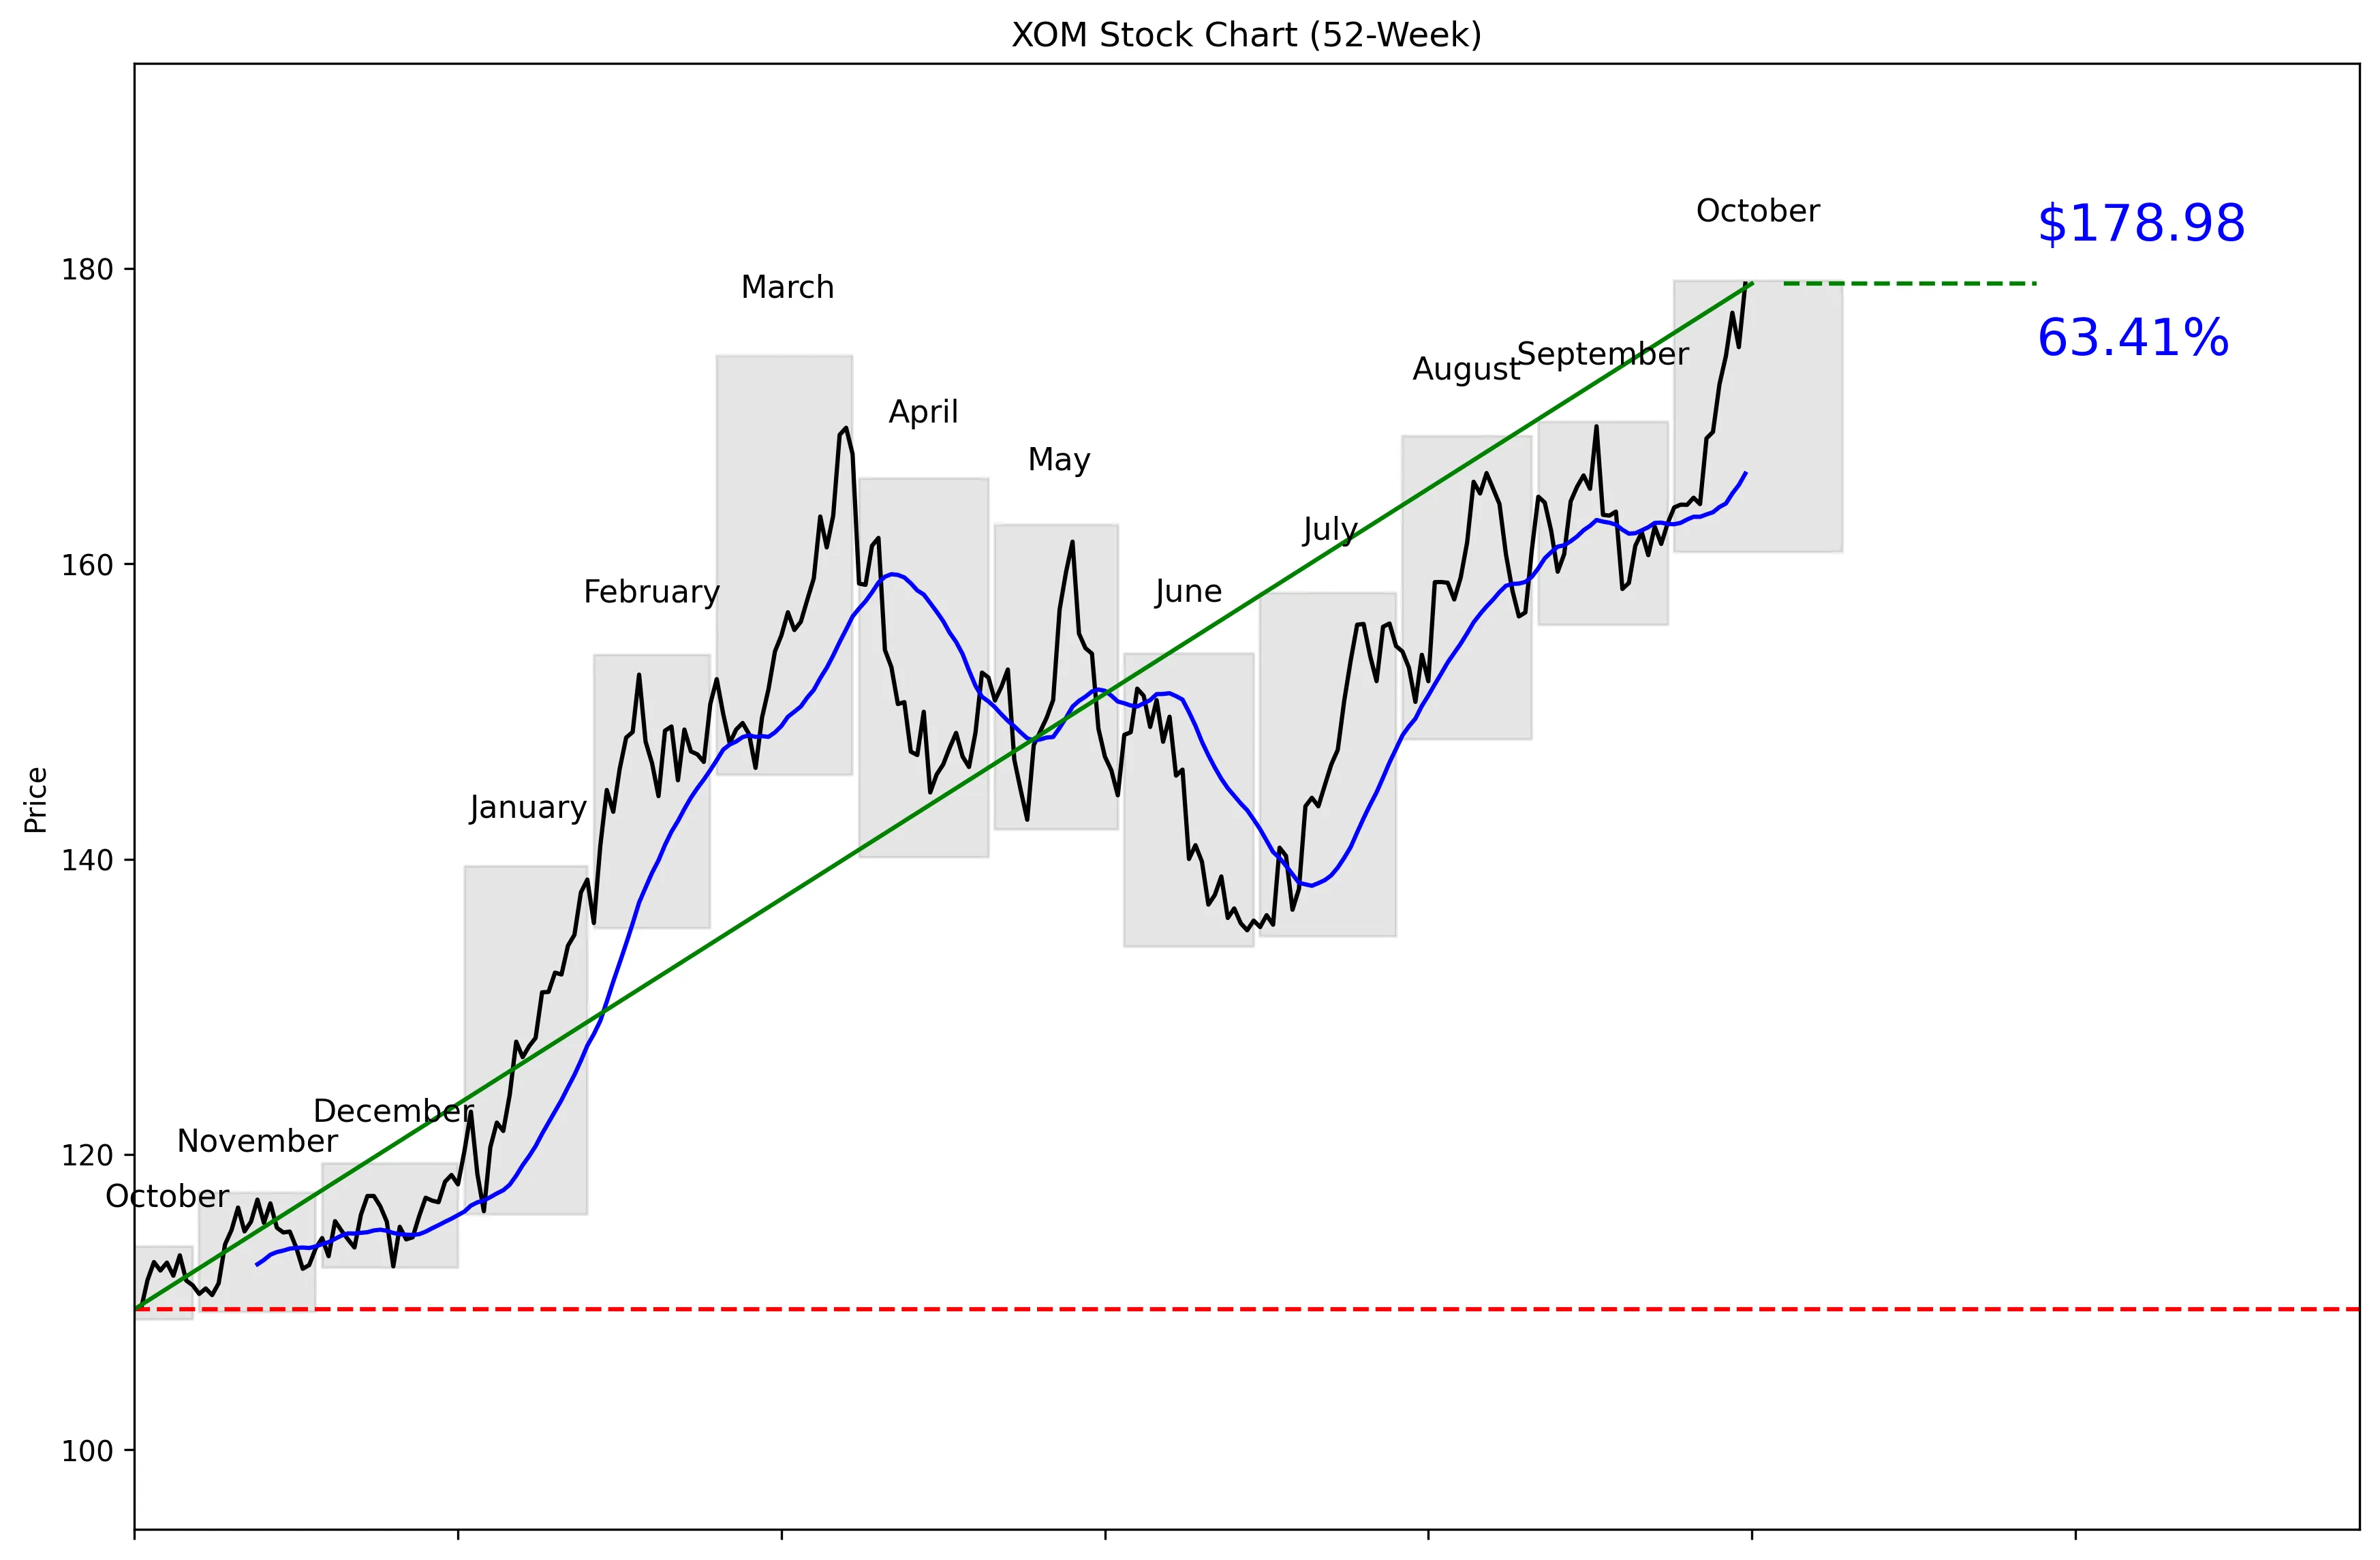
XOM 52-Week Stock Chart
Technical Analysis
XOM’s technical range runs from a 52-week low of $108.83 to a high of $179.16. The technical data places the stock 100% of the way from low to high, 0.10% below the high and 64.46% above the low. Five-day momentum is 5.94%, while 20-day momentum is 9.44%. The 20-day moving average is $166.11, with the technical snapshot reporting price at 7.74% versus that average. Near-term support is $158.30, and resistance is $178.98, although the stated $163.82 price conflicts with several of these technical readings.


Recent News and Developments

Exxon flags $4.5 billion refining lift for Q3

ExxonMobil said stronger Energy Products margins could add $4.5 billion to third-quarter earnings versus Q2, while total margin changes could contribute $4.4 billion. Lower liquids prices could reduce upstream earnings by $1.3 billion, partly offset by a $0.3 billion benefit from gas prices. Source: U.S. Securities and Exchange Commission

Three banks raise XOM price targets

On October 19, Barclays raised its XOM target from $177 to $200, J.P. Morgan moved from $166 to $186, and UBS increased its target from $185 to $199. All three maintained bullish ratings, while Piper Sandler kept a Hold rating and a $185 target. Source: Stock Analysis

Guyana may cut LNG plans to support Exxon oil output

ExxonMobil told Guyana it may need about 2 billion cubic feet of offshore gas per day for reinjection to maximize oil production, according to people familiar with the talks. Officials are considering reducing planned LNG capacity from 6 million metric tons per year to as much as 3 million, or abandoning exports in favor of domestic use. Source: Reuters via EnergyNow


Market Sentiment and Analyst Recommendations

Bull Case
Revenue is $361.06 billion, and reported revenue growth is 44.1%. Stronger Energy Products margins could add $4.5 billion to third-quarter earnings versus Q2, with total margin changes contributing $4.4 billion. Analyst sentiment is bullish: 22 analysts rate XOM a buy, with an average target of $169.68. Barclays raised its target to $200 on October 19, while J.P. Morgan moved to $186 and UBS to $199. The stock also gained 5.94% from its October 9 close of $168.94 to its October 16 close of $178.98, confirming strong near-term demand. The buy case is straightforward: rapid reported revenue growth, improving refining margins and rising analyst targets support further upside.
Bear Case
XOM trades at 21.11 times earnings, so investors are already paying for meaningful strength. The stated price of $163.82 leaves only $5.86 of upside to the $169.68 average analyst target. Total debt of $42.37 billion is four times the company’s $10.59 billion in cash. Lower liquids prices could reduce upstream earnings by $1.3 billion, while the expected gas-price benefit is only $0.3 billion. The technical data also puts XOM 100% through its 52-week range and just 0.10% below the $179.16 high, leaving little technical room before resistance. Piper Sandler’s Hold rating and $185 target show that bullish sentiment is not unanimous.
What to Watch
The third-quarter earnings impact from Energy Products margins is the central near-term catalyst, with Exxon indicating a potential $4.5 billion lift versus Q2. Investors should compare that with the expected $1.3 billion upstream hit from lower liquids prices and the $0.3 billion benefit from gas prices. Watch whether XOM holds the $158.30 near-term support level or challenges resistance at $178.98. The $166.11 20-day moving average is another useful threshold because the supplied price and technical readings currently conflict. Guyana’s decision on whether to reduce planned LNG capacity from 6 million metric tons per year to as much as 3 million, or abandon exports, could affect Exxon’s oil-production strategy. The thesis strengthens if refining gains materialize and resistance breaks; it weakens if upstream pressure dominates and support fails.
Analyst Consensus
BUY

Based on 22 analyst opinions
Low Target
$142.00
Mean Target
$169.68
High Target
$200.00


Earnings and Financial Data

Sector
Energy
Industry
Oil & Gas Integrated
Employees
57,900
Earnings & Dividends
Next Earnings
Oct 30, 2026
EPS (Trailing)
$7.76
Dividend Yield
251.0%
Payout Ratio
52.5%

Frequently Asked Questions

Is XOM a good stock to buy?
The consensus recommendation is buy based on 22 analysts, and reported revenue growth is 44.1%. The takeaway is that the available fundamental data is bullish, but the 21.11 P/E means the stock is not obviously cheap.
What is XOM’s price target?
The average analyst target is $169.68, with estimates ranging from $142.00 to $200.00. The takeaway is that expectations vary widely around the stated $163.82 share price.
What are XOM’s support and resistance levels?
Near-term support is $158.30, based on the 30-day low, while resistance is $178.98, based on the 30-day high. The takeaway is that these are the key technical levels supplied for the next move.
How strong is XOM’s momentum?
XOM’s five-day momentum is 5.94%, and its 20-day momentum is 9.44%. The takeaway is that momentum is positive across both measured periods.
Does XOM pay a dividend?
The provided data does not include XOM’s dividend or dividend yield. The takeaway is that no dividend conclusion can be made from this dataset.

Related Stock Reports

Disclaimer: This report is for informational purposes only and does not constitute financial advice. The analysis and opinions expressed are those of AltStation.io and should not be relied upon as the sole basis for investment decisions. Always conduct your own research and consult with a qualified financial advisor before making investment decisions. Past performance does not guarantee future results. Updated October 19, 2026.