ALTSTATION.IO

Targa Resources Corp. (TRGP) Stock Analysis

By Nova Skye | AltStation.io | Updated October 28, 2026

Price
$306.92
Change
+1.42%
Market Cap
$65.81B
Avg Volume
1.2M

Company Overview

Houston-based Targa Resources Corp. is an energy midstream company incorporated in 2005 that manages the physical infrastructure moving oil and gas across North America. The business operates across two core segments: Gathering and Processing, alongside Logistics and Transportation. In practice, Targa gathers, treats, compresses, and transports natural gas, natural gas liquids (NGLs), and crude oil from production fields to market hubs. Their customer base spans Gulf Coast refineries, petrochemical manufacturers, liquefied petroleum gas exporters, and independent propane retailers.

Targa maintains an established position across the midstream space by linking upstream basin gathering directly to downstream Gulf Coast processing and export hubs. Controlling complementary transport assets, including leased and owned railcars, vacuum trucks, and pressurized NGL barges, gives them logistical flexibility over competitors limited strictly to fixed pipe networks. Their main risk remains volume sensitivity, as midstream operations depend heavily on steady drilling activity and commodity throughput from upstream producers.

Right now, Targa stands anchored around its integrated NGL logistics and fractionation infrastructure to capture Gulf Coast industrial and export demand. The company continues to leverage its combined storage, terminaling, and transport network, moving beyond basic gas gathering to service multi-state wholesale and petrochemical end-users. That integrated setup gives TRGP a functional foundation to capture fee-driven processing and export volume as long as North American energy flows remain active.

Key Financials
Market Cap
$65.81B
Revenue
$16.74B
EBITDA
$5.50B
Gross Margin
43.2%
Profit Margin
13.5%
Revenue Growth
4.2%
Total Cash
$132.30M
Total Debt
$19.58B
Free Cash Flow
$65.84M


52-Week Price Performance Analysis

Price Statistics
P/E Ratio
29.34
Forward P/E
25.33
Beta
0.80
52-Week High
$308.46
52-Week Low
$150.00
EPS
$10.46
50-Day Avg
$289.60
200-Day Avg
$257.63
Price/Book
18.00
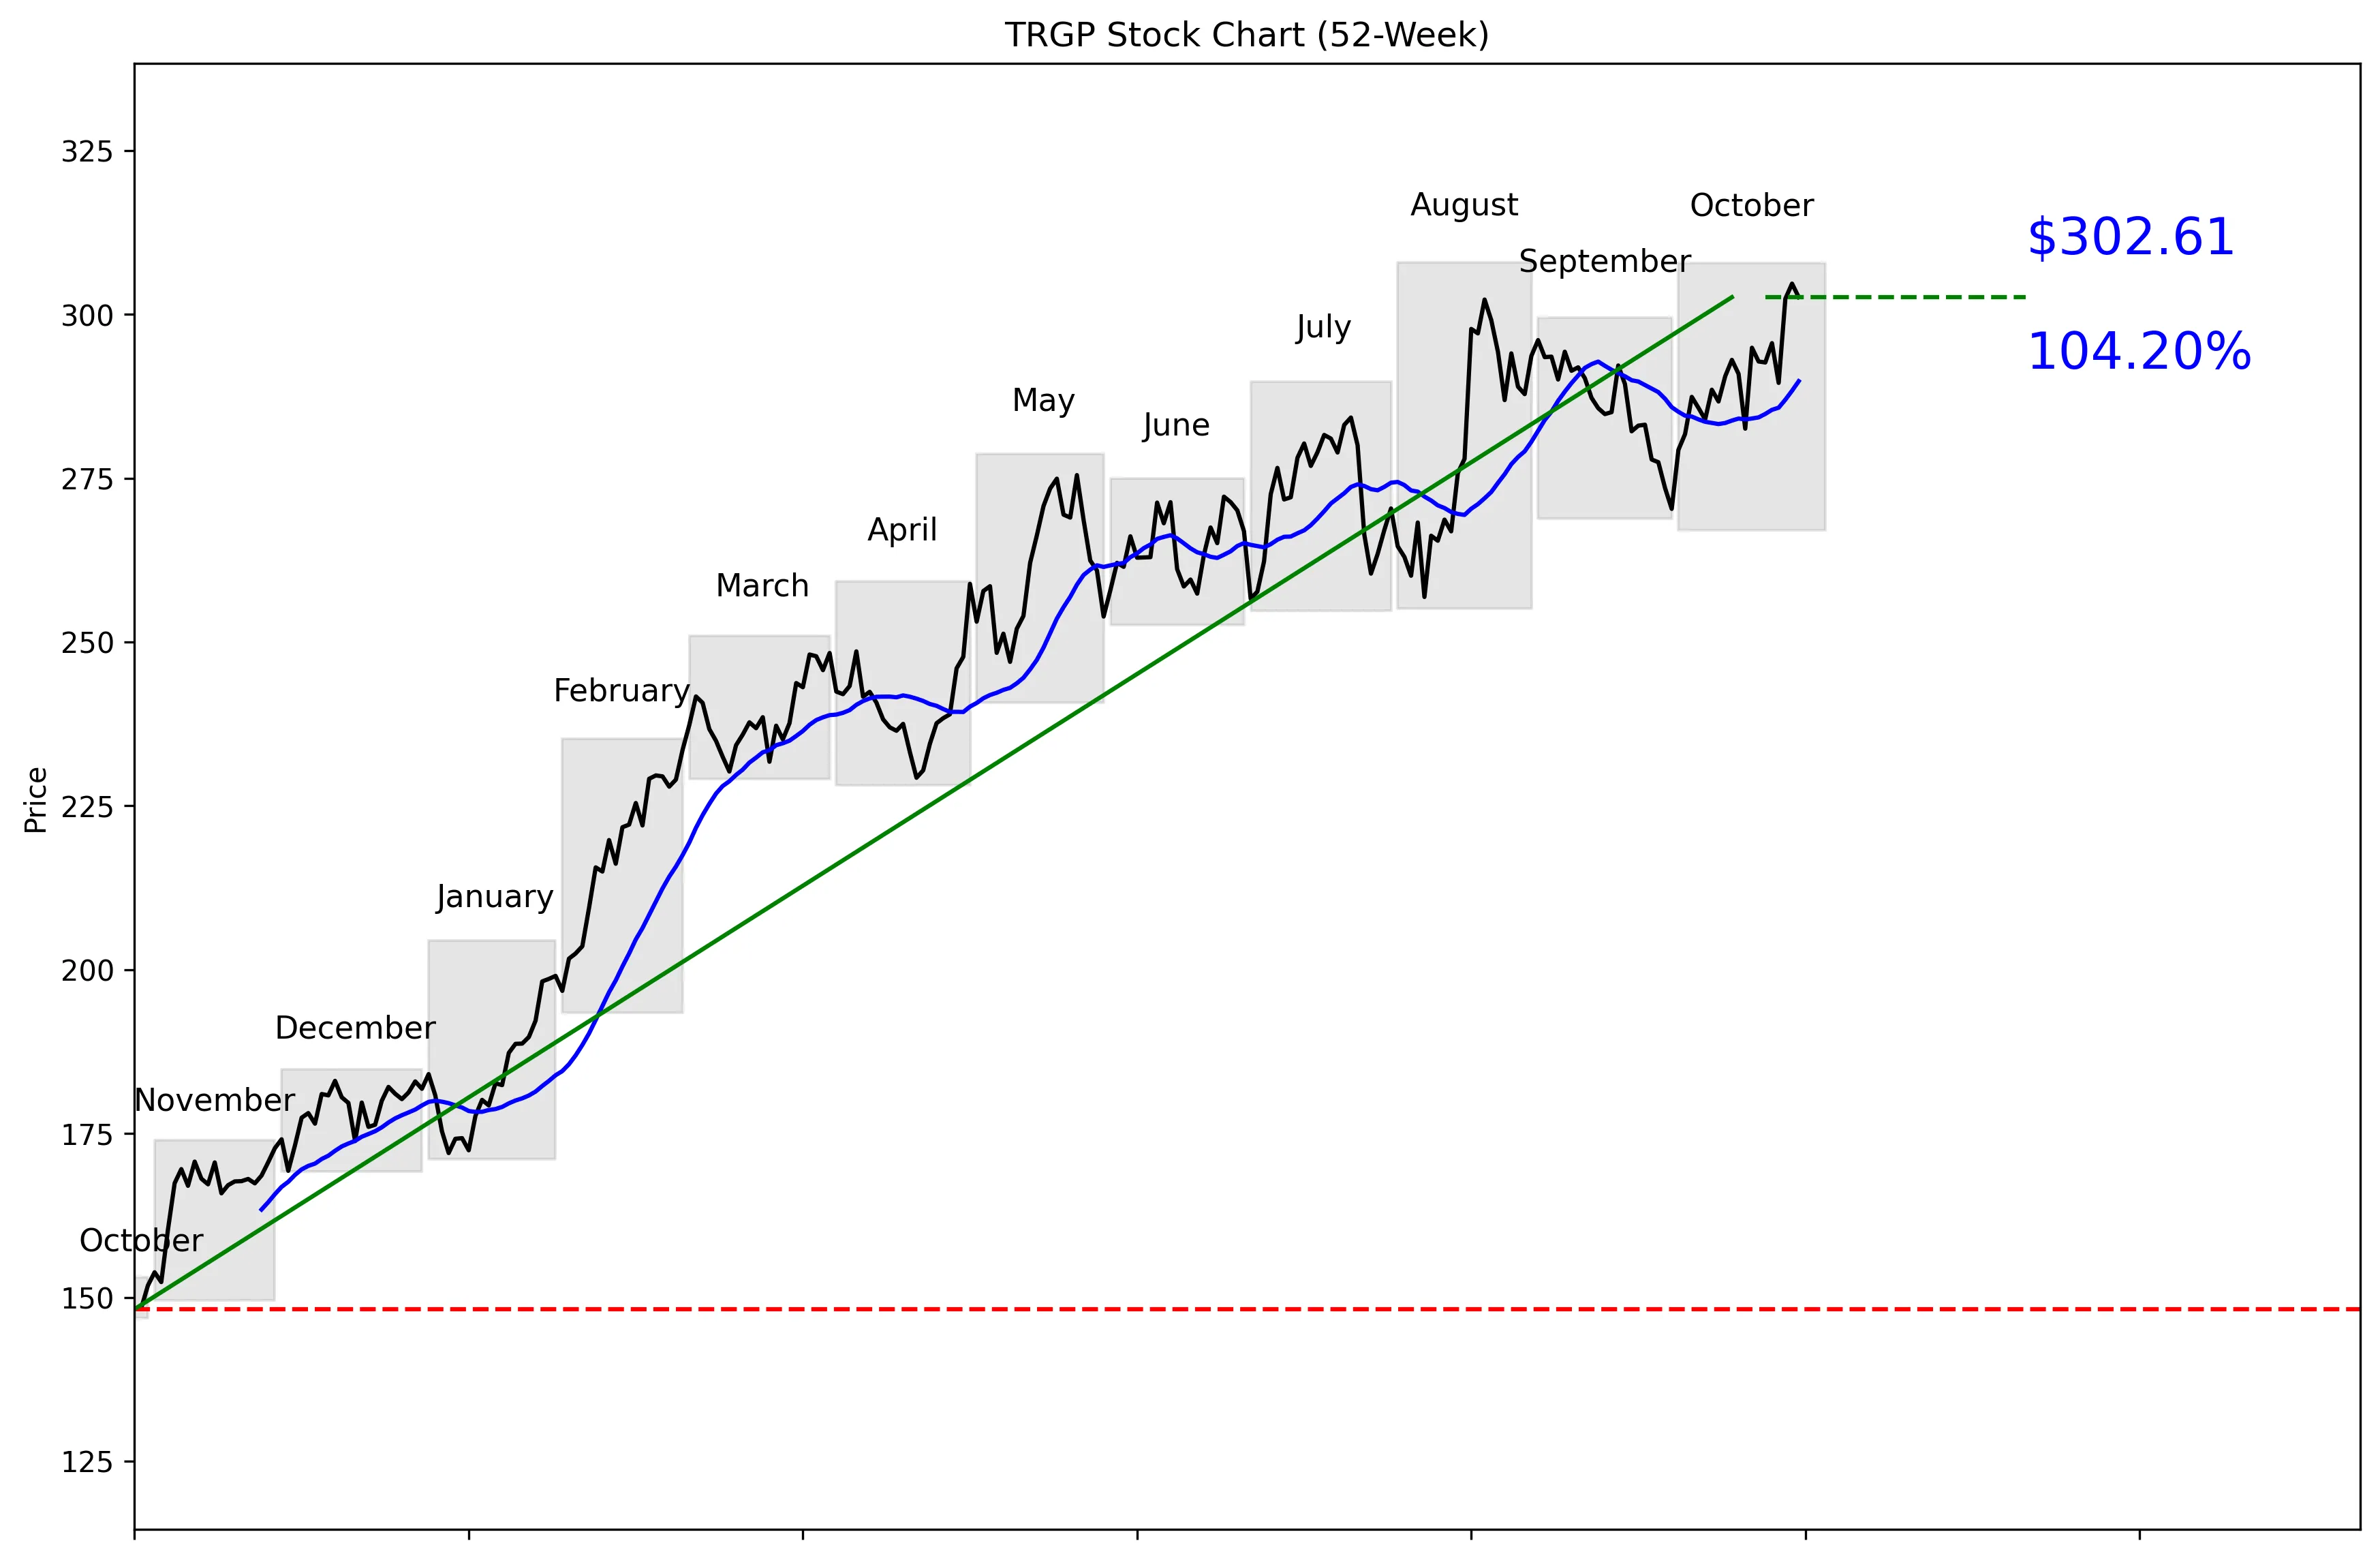
TRGP 52-Week Stock Chart
Technical Analysis
TRGP trades at $306.92, placing it 97% of the way from its $146.84 52-week low to its $307.94 high. The supplied technical data puts the stock 1.73% below that high and 106.08% above the low. Momentum is strong at 3.40% over five trading days and 10.65% over 20 trading days. The price is 4.42% above its $289.79 20-day moving average. TRGP has moved above the stated near-term resistance of $304.68, while the 30-day low of $270.31 is the key near-term support level.


Recent News and Developments

BMO lifts Targa price target to $328

BMO Capital maintained its Outperform rating on Targa Resources and raised its price target from $303 to $328. The call kept the firm bullish without changing its rating. Source: TipRanks

Targa shares suffer sharp intraday selloff

TRGP fell 4.99% to $283.10 during trading on October 22, cutting roughly $3 billion from its market value. The shares later recovered some ground and closed at $289.54, down 2.05%. Source: 24/7 Wall St.

TRGP rebounds more than 4% after selloff

Targa shares climbed 4.44% to $302.41 on October 23 after closing at $289.54 the previous day. The rebound erased the prior session’s closing loss and pushed the stock back above $300. Source: Global Banking & Finance Review


Market Sentiment and Analyst Recommendations

Bull Case
TRGP has strong price momentum and trades close to its 52-week high. The stock gained 10.65% over the last 20 trading days and sits 4.42% above its 20-day moving average. Revenue is growing 4.2% from a $16.74 billion base. Wall Street is firmly bullish: 21 analysts rate the stock strong buy, with an average target of $329.81. That target sits above the current $306.92 price, while the high-end target reaches $359.00. BMO reinforced the bullish case by raising its target from $303 to $328 while maintaining an Outperform rating.
Bear Case
TRGP is priced for strong execution at 29.34 times earnings. The stock already sits 97% of the way through its 52-week range, limiting the margin for disappointment. Revenue growth of 4.2% is positive, but it is not especially aggressive relative to that valuation. The balance sheet carries $19.58 billion in debt against only $132.30 million in cash. Price action can also turn violent: TRGP fell 4.99% intraday to $283.10 on October 22 before closing at $289.54. The low analyst target is $294.00, below the current $306.92 price, so not every analyst forecast offers upside.
What to Watch
No future earnings date or company event was provided, so the next-quarter thesis should be judged through price, momentum, growth, and analyst revisions. Watch whether TRGP can hold above the stated $304.68 near-term resistance after reaching $306.92. A move back below the $289.79 20-day moving average would weaken the current momentum signal. The $270.31 30-day low is the critical near-term support level supplied by the price series. Investors should also track whether revenue growth stays at or improves from 4.2%, especially with the stock trading at 29.34 times earnings. Analyst revisions matter: BMO raised its target from $303 to $328, while the broader target range remains $294.00 to $359.00.
Analyst Consensus
STRONG BUY

Based on 21 analyst opinions
Low Target
$294.00
Mean Target
$329.81
High Target
$359.00


Earnings and Financial Data

Sector
Energy
Industry
Oil & Gas Midstream
Employees
3,570
Earnings & Dividends
Next Earnings
Nov 05, 2026
EPS (Trailing)
$10.46
Dividend Yield
165.0%
Payout Ratio
40.6%

Frequently Asked Questions

Is TRGP a good stock to buy?
TRGP has a strong buy recommendation from 21 analysts and 10.65% momentum over the last 20 trading days. The bullish view is clear, but the 29.34 P/E and position near the top of its range make valuation discipline important.
What is TRGP’s price target?
The average analyst target is $329.81, with estimates ranging from $294.00 to $359.00. The takeaway is that the consensus target is above the current $306.92 price, although the lowest target is below it.
Is TRGP near its 52-week high?
TRGP is priced at $306.92 versus a technical 52-week high of $307.94, placing it 97% of the way from the $146.84 low to the high. The takeaway is that TRGP is trading near the top of its annual range.
What are TRGP’s support and resistance levels?
The supplied near-term support is the 30-day low of $270.31, while near-term resistance is the 30-day high of $304.68. With the price at $306.92, the takeaway is that TRGP has moved above the stated resistance level.
Does TRGP pay a dividend?
The provided data does not include a dividend amount, yield, or payment history. The takeaway is that no dividend conclusion can be made from the available information.

Related Stock Reports

Disclaimer: This report is for informational purposes only and does not constitute financial advice. The analysis and opinions expressed are those of AltStation.io and should not be relied upon as the sole basis for investment decisions. Always conduct your own research and consult with a qualified financial advisor before making investment decisions. Past performance does not guarantee future results. Updated October 28, 2026.