ALTSTATION.IO

Airbnb, Inc. (ABNB) Stock Analysis

By Nova Skye | AltStation.io | Updated September 19, 2026

Price
$186.29
Change
+1.65%
Market Cap
$111.55B
Avg Volume
4.4M

Company Overview

Airbnb operates an online marketplace that connects property hosts with travelers looking to book accommodations, local experiences, and travel services. The platform generates revenue by taking a cut of every booking from both guests and hosts, while also selling branded gift cards. Based in San Francisco, California, the company operates in the Travel Services industry within the Consumer Cyclical sector. Originally founded in 2007 as AirBed & Breakfast, the business rebranded to Airbnb, Inc. in November 2010 and now spans nearly every country across the globe.

Airbnb is the clear market leader in alternative accommodations, capturing roughly 44% of the global vacation rental market. Its core advantage is massive organic brand recognition backed by a network of over 9 million active listings. Competitors like Booking.com and Expedia’s Vrbo actively target this inventory, but Airbnb still dominates consumer mindshare without paying massive search advertising bills. The real headwind to watch is not competitor pricing, but tight local regulations and municipal short-term rental bans in major urban centers.

The company has successfully transitioned from a high-growth tech disruptor into a high-margin cash generator. Revenue rose 18.1% to $9.92 billion in 2023 and expanded another 12.0% to $11.10 billion in 2024. While annual top-line growth is naturally cooling down into the low double digits, the platform prints strong free cash flow. Management is now prioritizing international market expansion and quality control over raw listing growth to protect its pricing power.

Key Financials
Market Cap
$111.55B
Revenue
$13.16B
EBITDA
$2.76B
Gross Margin
82.9%
Profit Margin
20.4%
Revenue Growth
16.5%
Total Cash
$12.07B
Total Debt
$2.50B
Free Cash Flow
$3.21B


52-Week Price Performance Analysis

Price Statistics
P/E Ratio
42.53
Forward P/E
30.34
Beta
1.14
52-Week High
$193.45
52-Week Low
$110.81
EPS
$4.38
50-Day Avg
$161.34
200-Day Avg
$138.77
Price/Book
14.09
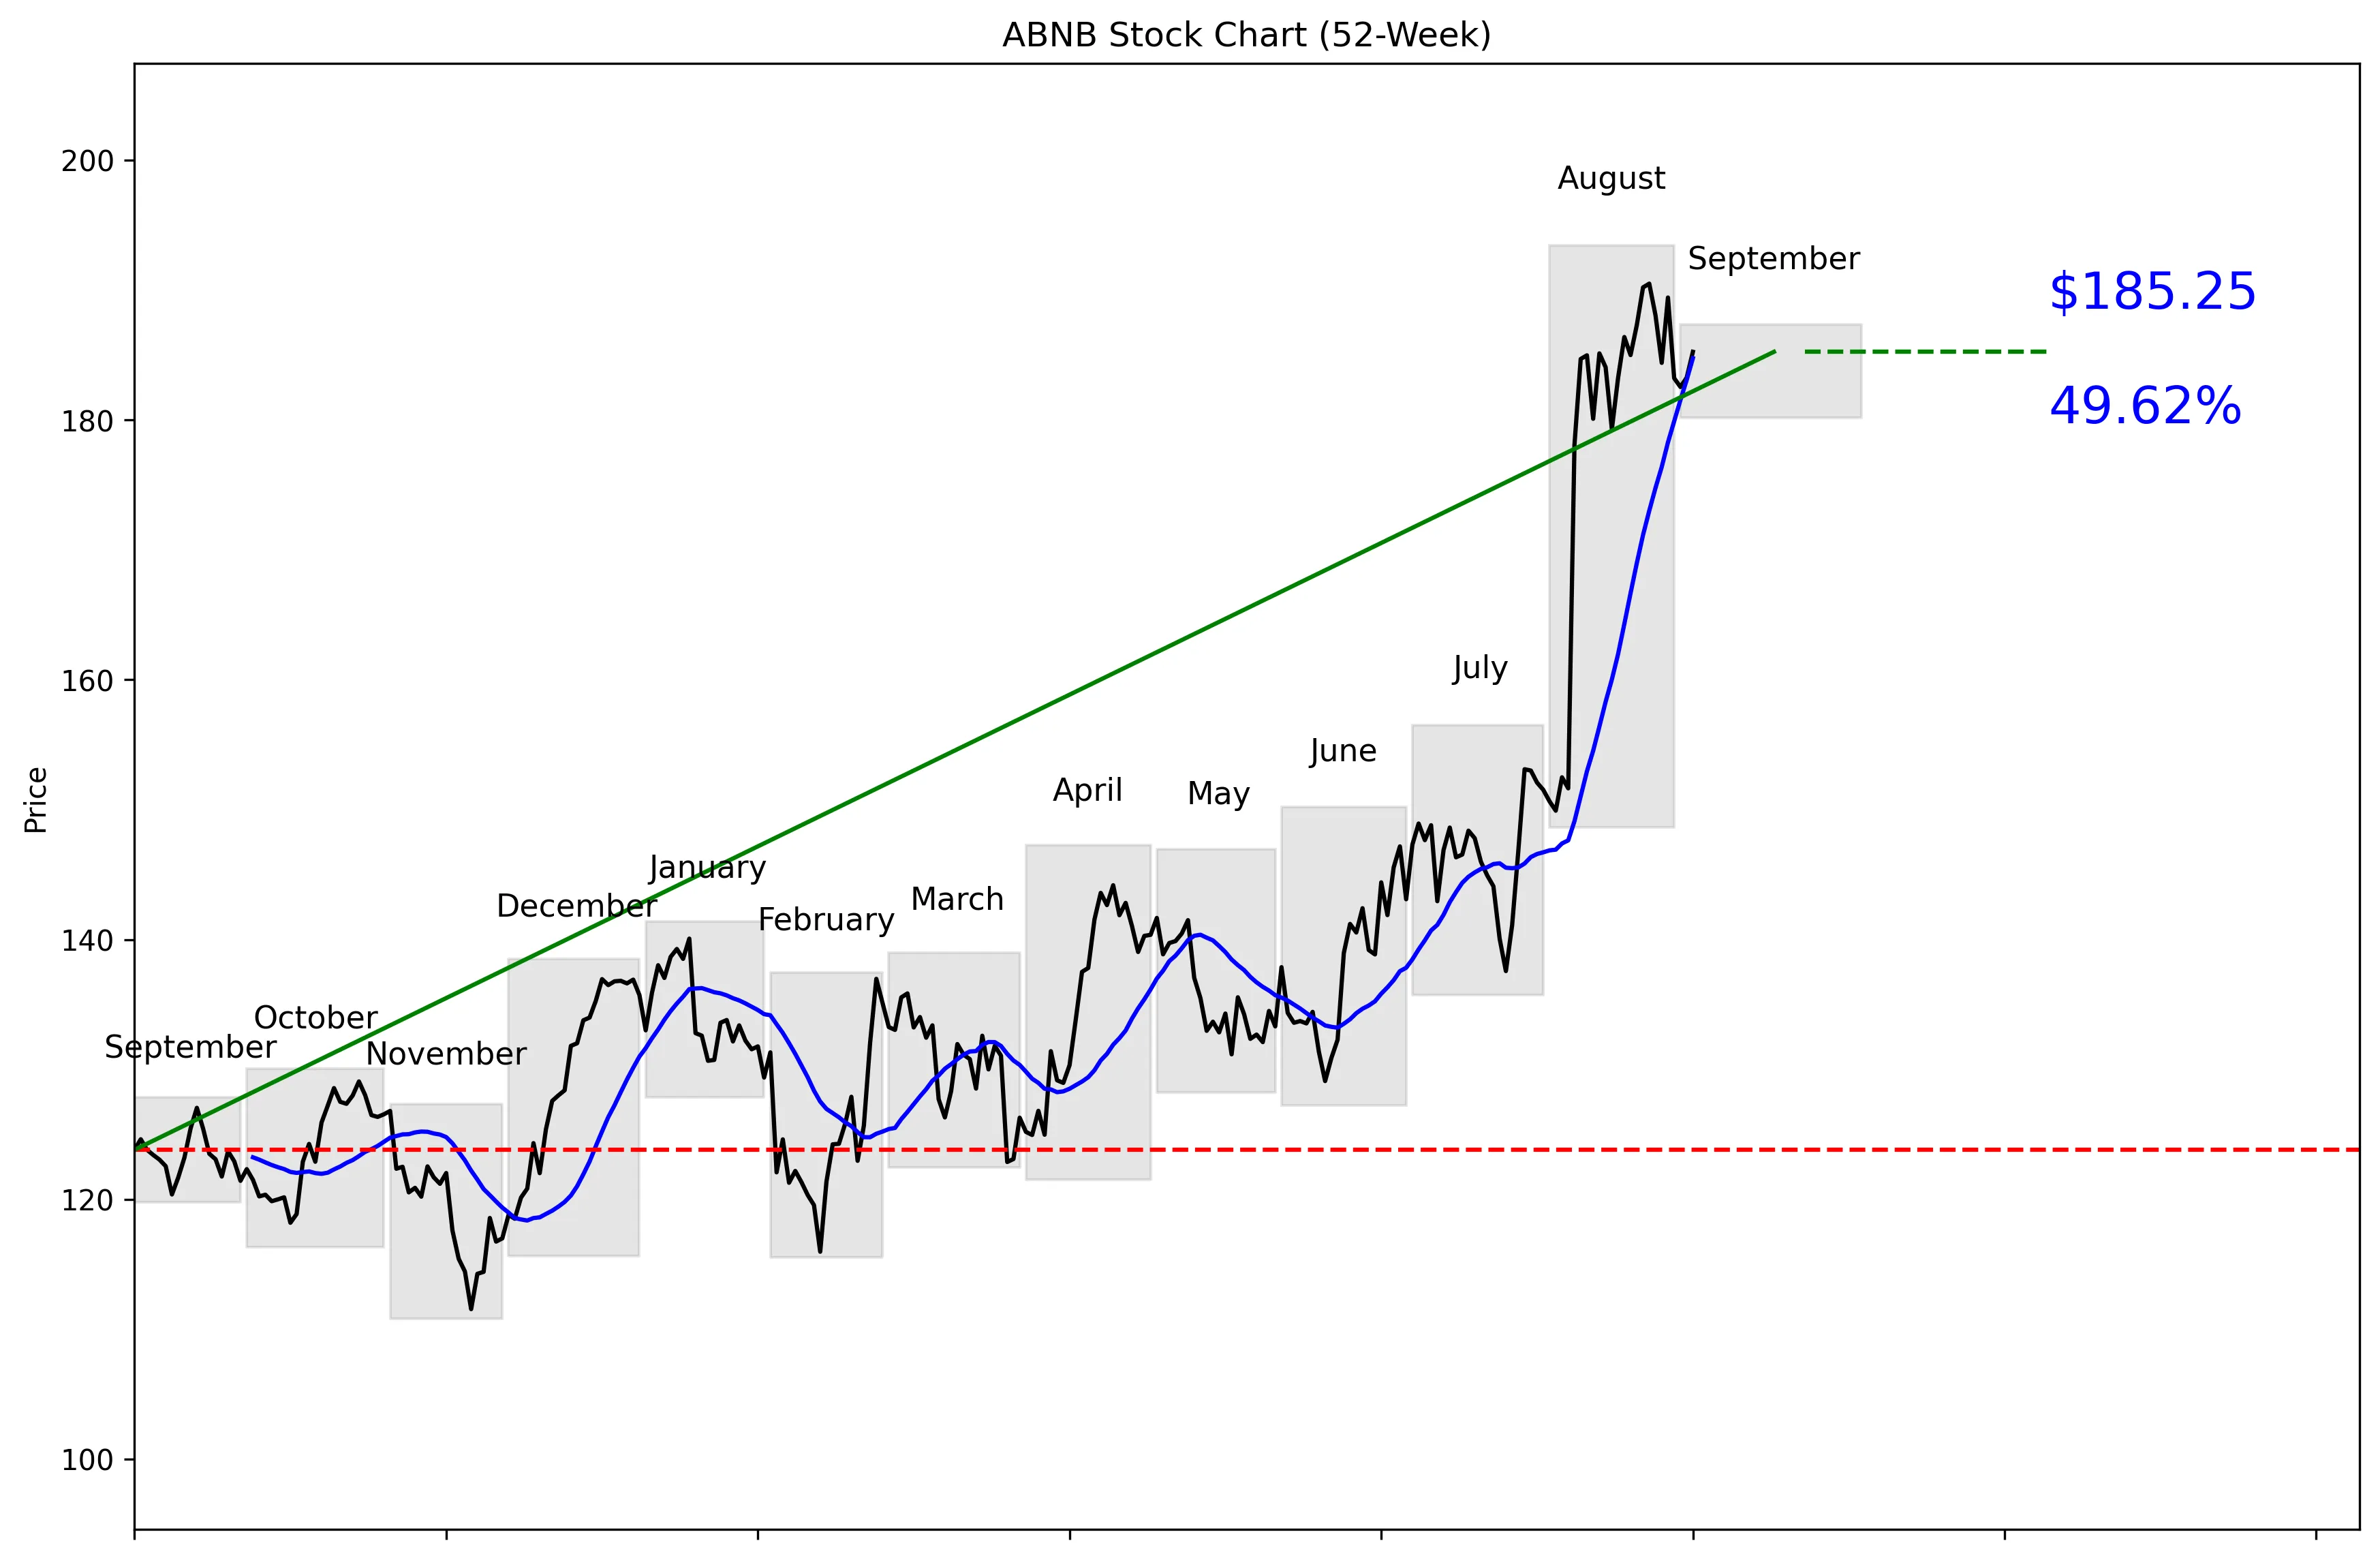
ABNB 52-Week Stock Chart
Technical Analysis
ABNB trades at $186.29, 90% of the way from its 52-week low of $110.81 to its high of $193.45. The stock is 4.24% below that high and 67.18% above the low, confirming a strong 52-week trend. It sits 0.27% above its 20-day moving average of $184.76. Momentum is 0.46% over five trading days but 22.16% over 20 days, so the rally has slowed recently. Near-term support is $141.10, while resistance sits at $190.50.


Recent News and Developments

Airbnb tests lower fees for host-sourced bookings

Airbnb is testing U.S. service fees of 6% or 10%, down from an average of 16%, for selected hosts using third-party listing software. Guests must book through a unique link shared by the host, giving Airbnb a new way to capture reservations that might otherwise go off-platform. Source: Yahoo Finance

Rosenblatt starts Airbnb at Buy with $220 target

Rosenblatt initiated Airbnb coverage with a Buy rating and $220 target after the shares closed at $183.22, implying roughly 20% upside. DA Davidson also raised its target from $175 to $220, while Rosenblatt highlighted second-quarter gross booking value of $27.2 billion, up 16%, and 10% growth in nights and seats booked. Source: Investing.com

Airbnb hires Pepijn Rijvers as chief business officer

Pepijn Rijvers joined Airbnb on September 1 to lead Homes, Hotels, Global Markets, and Enterprise Operations. He previously served as Tripadvisor Group’s chief business officer and spent 13 years at Booking.com in senior roles covering accommodations, supply, marketing, and international growth. Source: Airbnb Newsroom


Market Sentiment and Analyst Recommendations

Bull Case
Revenue is $13.16 billion and growing 16.5%, a strong rate for a company with a $111.55 billion market cap. Second-quarter gross booking value increased 16% to $27.2 billion, while nights and seats booked grew 10%. Airbnb’s fee test could capture host-sourced reservations that might otherwise happen off-platform, using service fees of 6% or 10% instead of the current 16% average. The balance sheet is solid, with $12.07 billion in cash against $2.50 billion in debt. Analysts rate the stock a buy across 40 recommendations, and the high end of the target range reaches $220. Rosenblatt and DA Davidson both set $220 targets, giving the bull case credible backing despite the stock’s recent run.
Bear Case
A P/E of 42.53 leaves little room for slowing growth or weak execution. The consensus analyst target is $178.96, which is $7.33 below the current price of $186.29. ABNB is already 90% through its 52-week range and only $4.21 below near-term resistance at $190.50. Twenty-day momentum is 22.16%, but five-day momentum has cooled to 0.46%, suggesting the latest surge may be losing force. Lower service fees could attract incremental bookings, but cutting an average fee of 16% to 6% or 10% creates an obvious monetization risk if volume does not compensate. Tighter European short-term rental rules and broader OECD tax-reporting requirements could add restrictions, complexity, and operating costs.
What to Watch
The fee test is the clearest near-term catalyst: investors need evidence that charging 6% or 10% can bring enough off-platform bookings onto Airbnb to offset the reduction from the 16% average fee. Track whether gross booking value can maintain its recent 16% growth from the reported $27.2 billion level. Nights and seats booked grew 10%, and a slowdown from that rate would weaken the volume side of the thesis. Pepijn Rijvers started as chief business officer on September 1, with responsibility for Homes, Hotels, Global Markets, and Enterprise Operations; execution across those businesses now matters. Watch the European Commission’s proposed short-term rental framework and Airbnb’s challenge to the OECD tax-reporting amendments for signs of higher compliance pressure. Technically, a move above $190.50 would challenge the $193.45 high, while a break below the $184.76 moving average would put the rally under pressure; the stated near-term support is $141.10.
Analyst Consensus
BUY

Based on 40 analyst opinions
Low Target
$125.00
Mean Target
$178.96
High Target
$220.00


Earnings and Financial Data

Sector
Consumer Cyclical
Industry
Travel Services
Employees
8,200
Earnings & Dividends
Next Earnings
Nov 05, 2026
EPS (Trailing)
$4.38
Dividend Yield
None
Payout Ratio
0%

Frequently Asked Questions

Is ABNB a good stock to buy?
The recommendation is buy based on 40 analysts, and revenue is growing 16.5%. The stock is also above the $178.96 consensus target, so the takeaway is that analysts like the company more than the current entry price.
What is ABNB’s price target?
The analyst target is $178.96, with estimates ranging from $125.00 to $220.00. The takeaway is that expectations vary widely and the consensus target sits below the current $186.29 price.
Is ABNB stock expensive?
ABNB trades at a P/E of 42.53 with revenue of $13.16 billion and revenue growth of 16.5%. The takeaway is that the valuation demands continued strong growth.
Does Airbnb have a strong balance sheet?
Airbnb holds $12.07 billion in cash and $2.50 billion in debt. The takeaway is that cash substantially exceeds debt.
What are ABNB’s key technical levels?
Near-term support is $141.10 and resistance is $190.50, with the stock currently at $186.29. The takeaway is that ABNB is close to resistance and 4.24% below its 52-week high of $193.45.

Related Stock Reports

Disclaimer: This report is for informational purposes only and does not constitute financial advice. The analysis and opinions expressed are those of AltStation.io and should not be relied upon as the sole basis for investment decisions. Always conduct your own research and consult with a qualified financial advisor before making investment decisions. Past performance does not guarantee future results. Updated September 19, 2026.