ALTSTATION.IO

Expedia Group, Inc. (EXPE) Stock Analysis

By Nova Skye | AltStation.io | Updated September 19, 2026

Price
$292.94
Change
+1.77%
Market Cap
$35.16B
Avg Volume
1.6M

Company Overview

Expedia Group, Inc. is a Seattle-based travel services company in the consumer cyclical sector that sells hotel bookings, flights, vacation rentals, and packaged trips. Founded in 1996 and renamed in March 2018, the company operates across three main divisions: retail consumer booking, commercial business-to-business infrastructure, and hotel search referrals through trivago. Retail travelers use its core portfolio, including Brand Expedia, Hotels.com, Vrbo, Orbitz, and Travelocity, to plan and pay for trips. On the commercial side, airlines, banks, offline agents, and corporate travel managers buy Expedia’s technology and wholesale travel inventory to run booking programs for their own customers.

Expedia is an established market heavyweight, but it functions as a challenger fighting on two tough fronts. Its primary structural edge is a massive business-to-business network that monetizes corporate partners without needing to constantly re-acquire individual travelers. The main threat is relentless ad competition, underscored by the record 17.8 billion dollars that the top four global travel players poured into sales and marketing in 2024. Airbnb maintains a firmer grip on vacation rentals over Vrbo, while Booking Holdings continues to hold the upper hand in European hotel volume.

The company is growing and actively pivoting toward its higher-margin enterprise business. Total revenue and gross bookings increased by 7% in 2024, driven by a 24% surge in fourth-quarter business-to-business bookings. Supplying back-end travel booking tools to banks and loyalty programs provides a much cleaner revenue stream than spending heavily to win individual retail search clicks. If management keeps scaling this wholesale distribution channel, it will insulate the business from consumer travel volatility and build far more durable margins.

Key Financials
Market Cap
$35.16B
Revenue
$15.70B
EBITDA
$2.89B
Gross Margin
90.4%
Profit Margin
13.0%
Revenue Growth
14.0%
Total Cash
$7.13B
Total Debt
$5.69B
Free Cash Flow
$3.43B


52-Week Price Performance Analysis

Price Statistics
P/E Ratio
18.44
Forward P/E
11.99
Beta
1.25
52-Week High
$342.00
52-Week Low
$185.34
EPS
$15.89
50-Day Avg
$296.24
200-Day Avg
$259.60
Price/Book
29.08
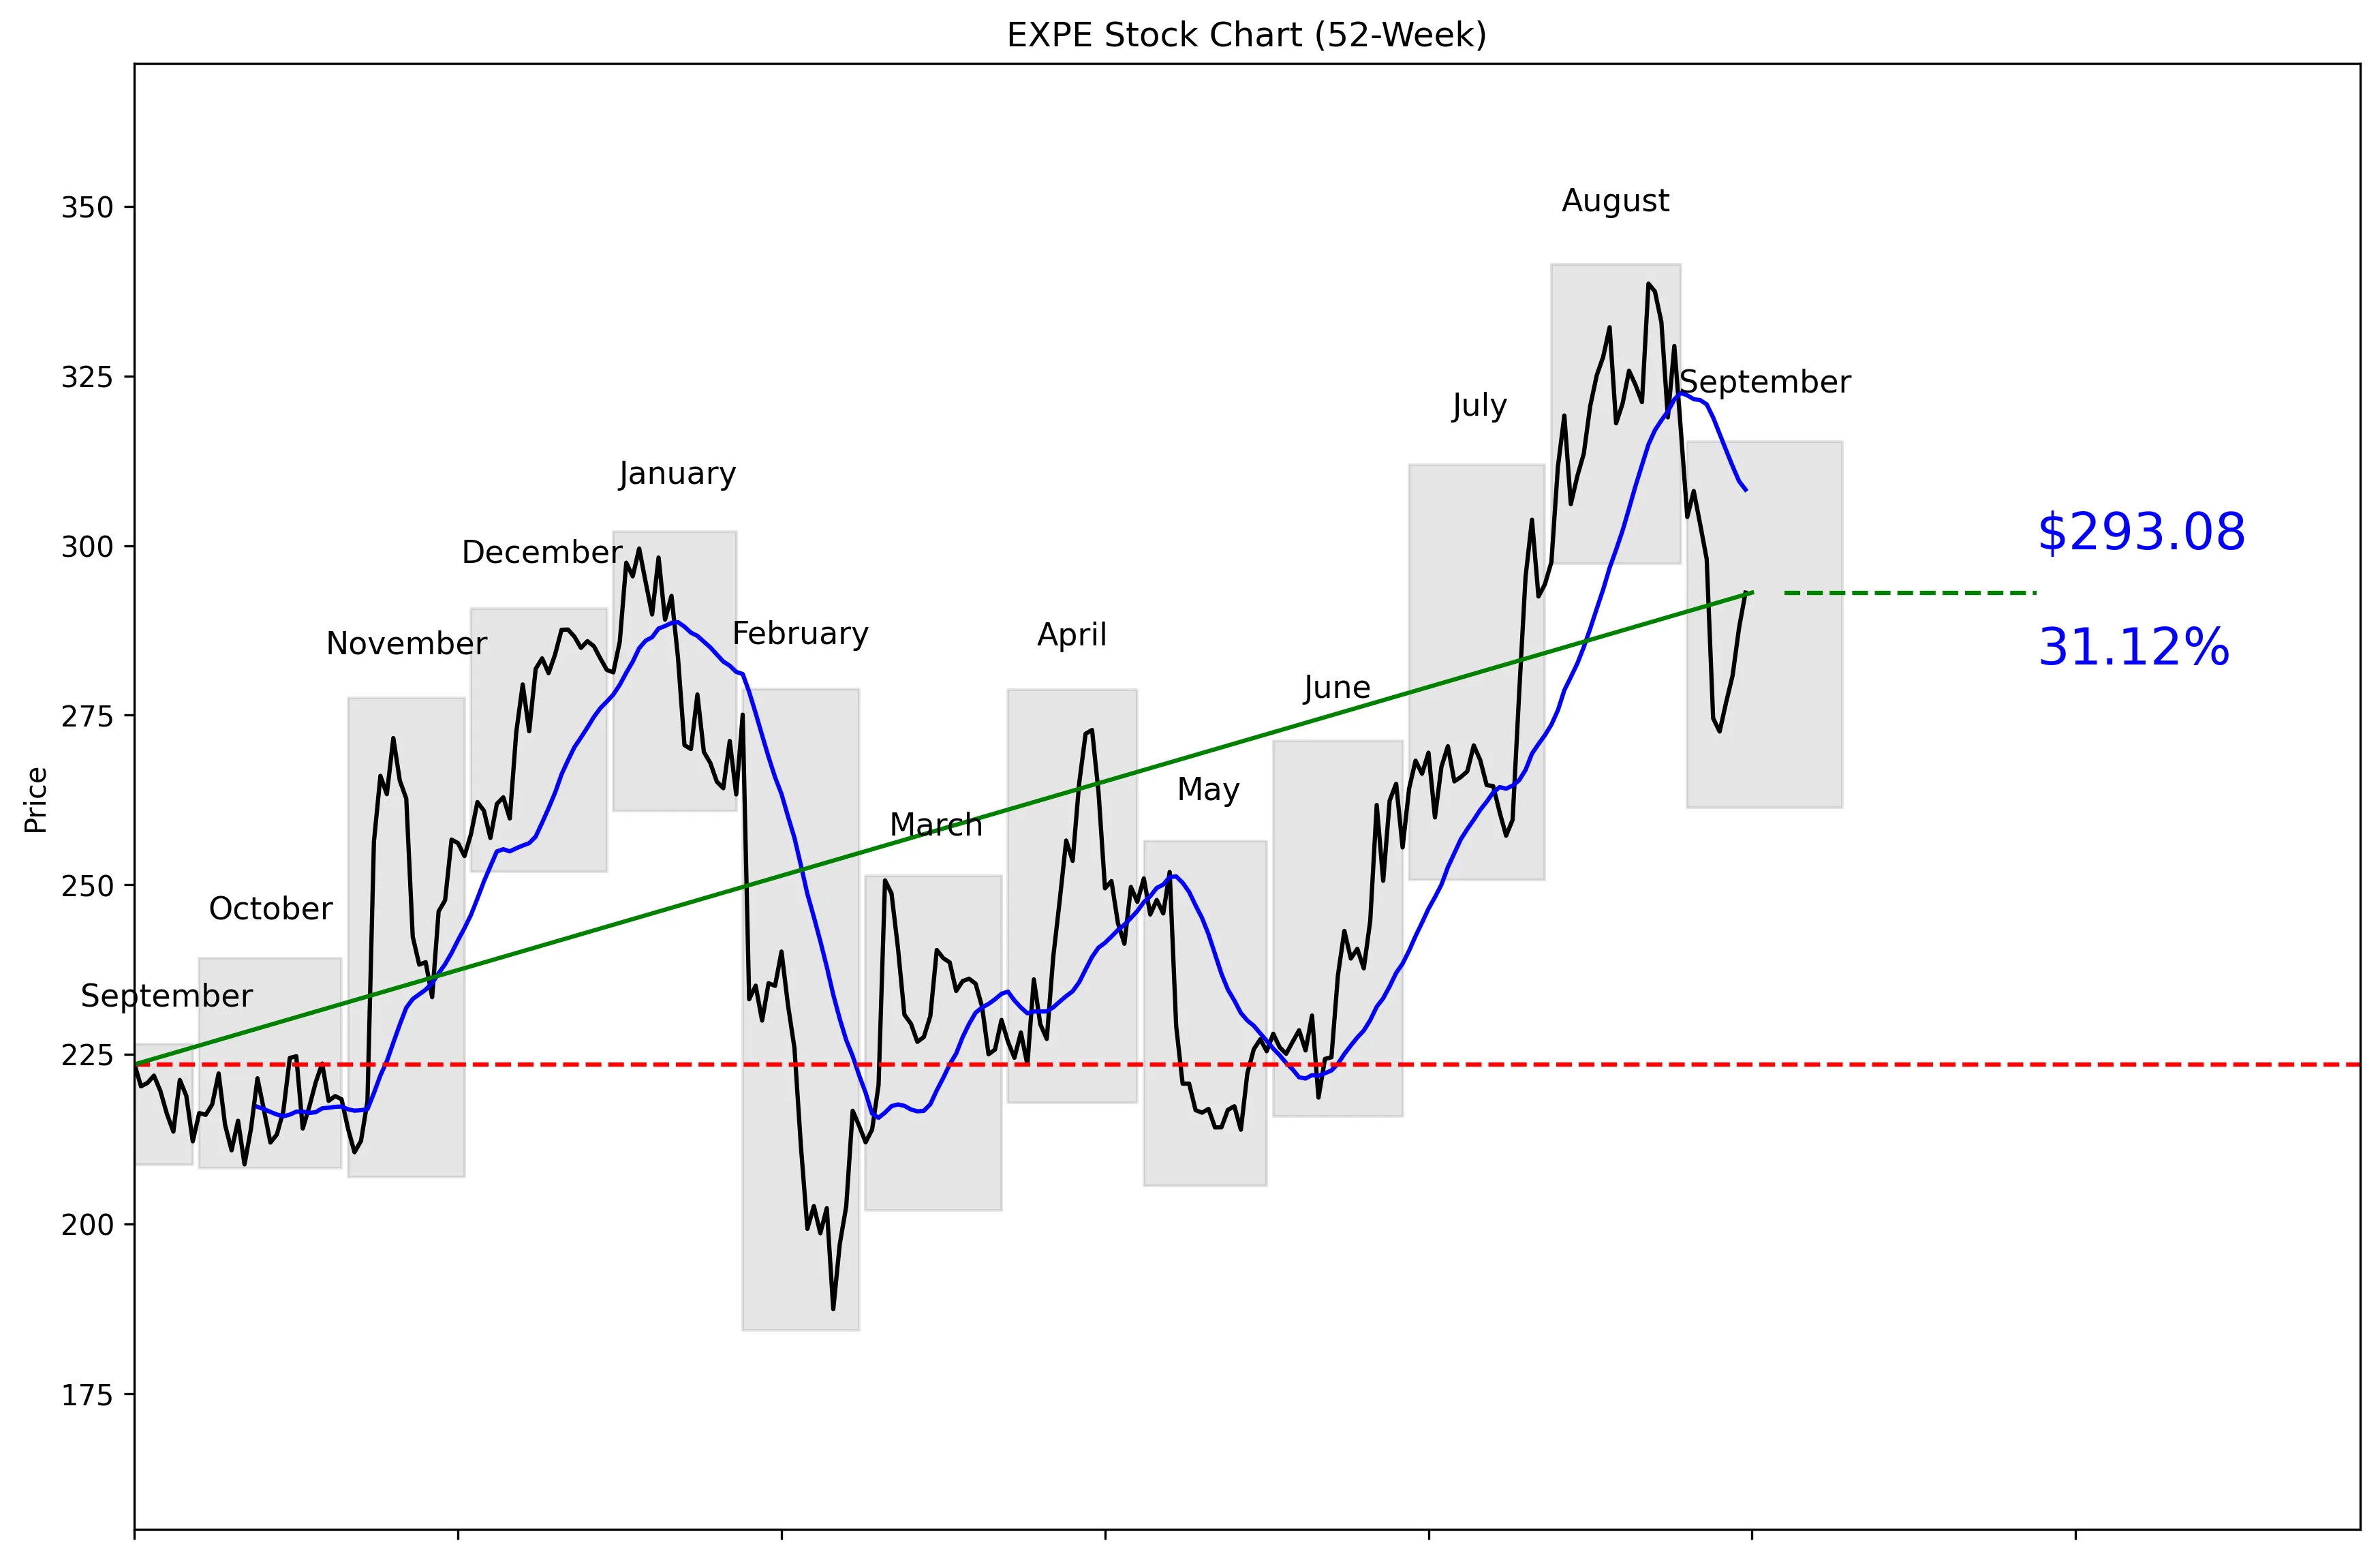
EXPE 52-Week Stock Chart
Technical Analysis
EXPE trades at $292.94, 69% of the way from its $184.28 52-week low to its $341.51 high. The stock is 14.18% below that high but remains 59.04% above the low. Five-day momentum is strong at 6.75%, while 20-day momentum remains negative at -7.85%. Price is 4.93% below the 20-day moving average of $308.27, so the short-term trend has not fully recovered. Near-term support is $272.60, while resistance sits at $338.64.


Recent News and Developments

Morgan Stanley cuts Expedia to Sell

Morgan Stanley downgraded EXPE to Sell on September 16 and cut its price target from $300 to $235. The target sits 19.82% below the stock’s September 15 close of $293.08. Source: StockAnalysis

Expedia says AI is speeding product development

Expedia CEO Ariane Gorin said AI has cut technology and product development cycle times by 40%, while an agentic voice system now resolves 10% of Vrbo partner queries. Natural-language searches also provide 60% more information about traveler intent, though Gorin said they are not yet improving conversion. Source: PhocusWire

EXPE rebounds 7.5% in four sessions

Expedia climbed from $272.60 on September 9 to $293.08 on September 15, a 7.5% gain. Shares advanced in four consecutive sessions through September 15, including a 1.81% gain on volume of roughly 2.06 million shares. Source: MarketMinute


Market Sentiment and Analyst Recommendations

Bull Case
Expedia is producing 14.0% revenue growth on $15.70 billion in revenue, which is the strongest fundamental argument for owning the stock. The company has $7.13 billion in cash against $5.69 billion in debt, leaving cash $1.44 billion above debt. At $292.94, EXPE trades at 18.44 times earnings, a reasonable valuation if that revenue growth continues. The $340.64 analyst target implies 16.28% upside, and the recommendation is buy across 36 analysts. AI has already cut technology and product development cycle times by 40%, while an agentic voice system resolves 10% of Vrbo partner queries. The bull case is straightforward: sustained growth, a solid cash position, faster product development and credible upside to the analyst target.
Bear Case
Morgan Stanley’s September 16 downgrade to Sell directly challenges the broader buy recommendation. Its new $235 target is below both the current $292.94 price and the broader analyst range floor of $245.00. That target was reported as 19.82% below EXPE’s September 15 close of $293.08. The technical picture also carries risk: EXPE is 4.93% below its 20-day moving average, and 20-day momentum is -7.85%. AI is providing 60% more traveler-intent information from natural-language searches, but management said it is not yet improving conversion. A break below $272.60 support would weaken the rebound and put more weight behind Morgan Stanley’s bearish call.
What to Watch
The first test is whether EXPE can hold the $272.60 30-day support level after rebounding from that price on September 9. The stock climbed to $293.08 by September 15, a 7.5% gain across four consecutive sessions, but it remains below the $308.27 20-day moving average. Reclaiming $308.27 would strengthen the near-term setup, while a move toward $338.64 would test the 30-day resistance level. Investors should monitor whether 14.0% revenue growth holds and whether the company can build on its current $15.70 billion revenue base. Expedia also needs to show that the 40% reduction in product development cycle times and the 10% Vrbo query-resolution rate translate into better commercial results. Most importantly, watch for evidence that natural-language search begins improving conversion; right now, the company says it does not.
Analyst Consensus
BUY

Based on 36 analyst opinions
Low Target
$245.00
Mean Target
$340.64
High Target
$430.00


Earnings and Financial Data

Sector
Consumer Cyclical
Industry
Travel Services
Employees
16,000
Earnings & Dividends
Next Earnings
Nov 05, 2026
EPS (Trailing)
$15.89
Dividend Yield
67.0%
Payout Ratio
11.1%

Frequently Asked Questions

Is EXPE a good stock to buy?
EXPE carries a buy recommendation from 36 analysts and has 14.0% revenue growth. The clear takeaway is that the available fundamental data supports the buy case, though the stock is below its 20-day moving average.
What is EXPE’s price target?
The analyst target is $340.64, with estimates ranging from $245.00 to $430.00. The clear takeaway is that the average target sits above the current $292.94 price.
What is EXPE’s 52-week range?
The key-data range is $185.34 to $342.00, while the technical price series shows an exact low of $184.28 and high of $341.51. The clear takeaway is that EXPE currently sits 69% of the way from the technical low to the technical high.
Is EXPE overvalued?
EXPE trades at a P/E ratio of 18.44 and has revenue growth of 14.0%. The clear takeaway is that valuation must be judged against whether that growth rate can continue.
What are EXPE’s support and resistance levels?
Near-term support is the 30-day low of $272.60, and near-term resistance is the 30-day high of $338.64. The clear takeaway is that these are the key price thresholds to monitor.

Related Stock Reports

Disclaimer: This report is for informational purposes only and does not constitute financial advice. The analysis and opinions expressed are those of AltStation.io and should not be relied upon as the sole basis for investment decisions. Always conduct your own research and consult with a qualified financial advisor before making investment decisions. Past performance does not guarantee future results. Updated September 19, 2026.